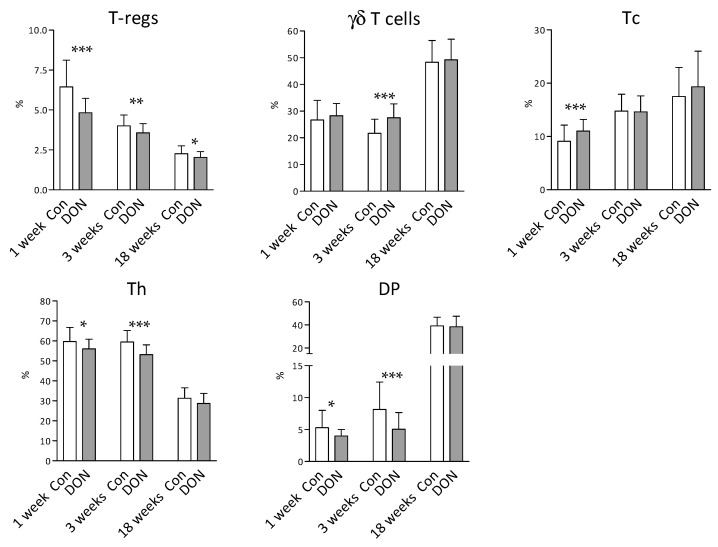
Figure 4.
T-lymphocyte subpopulations in the blood of the piglets acquired by flow cytometry. The data were obtained from piglets after intrauterine DON exposure (DON in grey columns) and compared to the control piglets (Con in white columns) at 1, 3, and 18 weeks after birth. Data are expressed as percentage (%) for each lymphocyte population according to the gating strategy (Figure A1). Columns represent the mean and error bars the standard deviation. The number of piglets in each group was as follows: 1 week control, n = 36; 1 week DON: n = 39; 3 weeks control, n = 33; 3 weeks DON, n = 38; 18 weeks control, n = 27; 18 weeks DON, n = 32. The Mann–Whitney test was used for statistical analysis. Significant differences between the DON and control groups are marked as * p < 0.05, ** p < 0.01, or *** p < 0.001. Regulatory T cells (T-regs; CD3+CD4+CD25+FoxP3+), γδ T cells (CD3+γδTCR+CD4-CD8+/-), cytotoxic T cells (Tc; CD3+γδTCR-CD4-CD8+), helper T cells (Th; CD3+γδTCR-CD4+CD8+/-), and double positive CD4+CD8+ cells (DP; CD3+γδTCR-CD4+CD8+).

