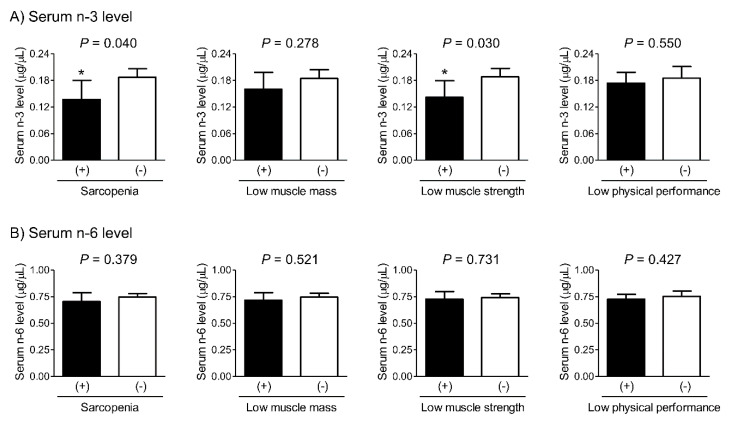
Figure 1.
Differences in serum levels of n-3 (A) and n-6 (B) fatty acids according to the status of sarcopenia and related parameters after adjusting for sex, age, and BMI. * indicates a statistically significant difference from control. The estimated mean values with 95% confidence intervals were generated and compared using analysis of covariance. BMI, body mass index.

