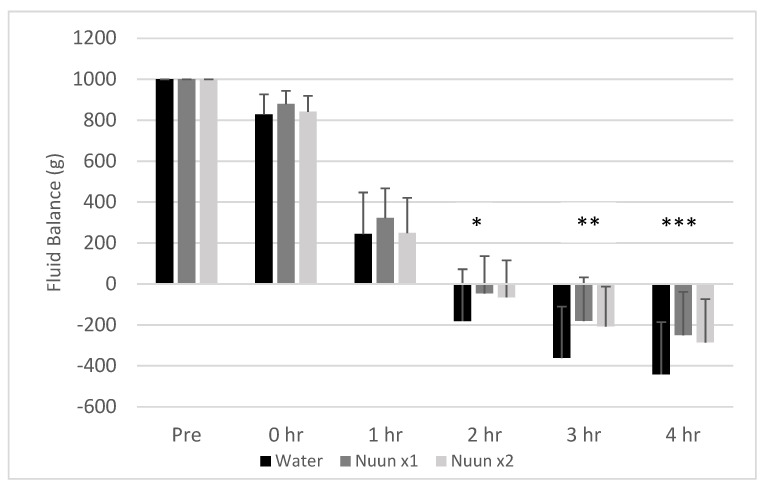
Figure 5.
Fluid balance of 18 men and women through four hours after consuming water only and Nuun+water; Values are mean ± standard deviation; hr is hour(s) after condition ingestion, Nuun x1 is Nuun beverage at normal concentration, Nuun x2 is Nuun beverage at double concentration; * Water lower than Nuun x1 (p = 0.02) and Nuun x2 (p = 0.04); ** Water lower than Nuun x1 (p = 0.002) and Nuun x2 (p = 0.008); *** Water lower than Nuun x1 (p = 0.001) and Nuun x2 (p = 0.007); No other differences of statistical significance noted (p > 0.05).

