Figure 4.
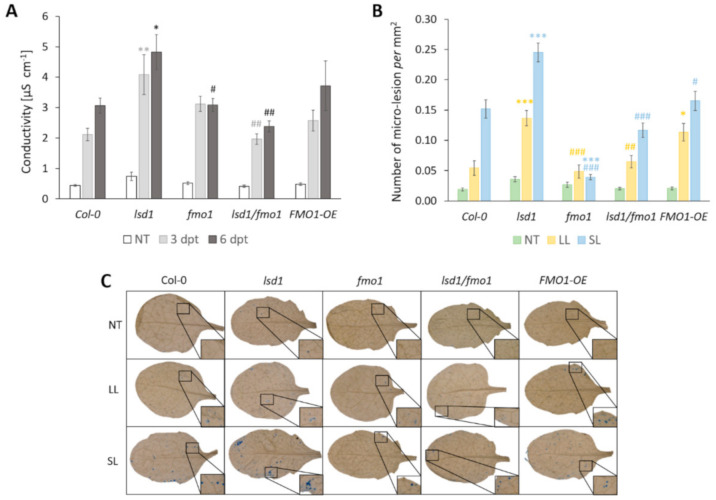
Cell death in wild type, lsd1, fmo1, lsd1/fmo1 and FMO1-OE Arabidopsis thaliana plants, quantified as cellular electrolyte leakage from the whole rosettes in non-treated (NT) plants, plants 3 days post treatment (3 dpt) and 6 days post treatment (6 dpt). Values ± SD are averages of 6 rosettes for two independent experiments (n = 12) (A). Cell death quantified as micro-lesion number in non-treated (NT), local leaves exposed to EL stress (LL) and systemic leaves (SL). Values ± SD are averages of 12 leaves for two independent experiments (n = 24) (B). Symbols above the bars indicate the significant difference from the wild type (Col-0) at the level of p < 0.05 (*), p < 0.005 (**) or p < 0.001(***) or from lsd1 mutant at the level of p < 0.05 (#), p < 0.005 (##) or p < 0.001(###) as indicated by the Tukey’s multiple comparison test. The representative pictures of micro-lesions in the wild type (Col-0), lsd1, fmo1, lsd1/fmo1 mutants and FMO1-OE line in non-stress as well as local EL-treated leaves (LL) and systemic leaves (SL) (C).

