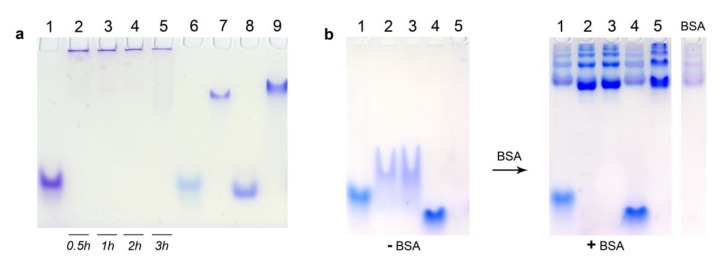
Figure 4.
Comparative electrophoretic mobilities of control oligonucleotides and dodecyl oligonucleotide conjugates. (a) 17 (Lane 1), D-17PG* (Lanes 2–5), 13 (Lane 6), D-13PG (Lane 7), 22 (Lane 8), D-22PG (Lane 9) investigated by electrophoretic mobility shift assay (EMSA) in non-denaturing 6.5% PAAG after 3 h* incubation in TAM buffer, at 25 °C; each sample contained 20 µM of the oligomer. (b) 13 (Lane 1), D-13 (Lane 2), D-13PG (Lane 3), 17 (Lane 4), D-17PG (Lane 5) investigated by non-denaturing 8% PAGE after 3 h incubation at 35 °C and additional no (−BSA) or adding (+BSA) of 45 µM bovine serum albumin (BSA without oligomers control lane is depicted on the right); each sample contained 25 µM of the oligomer in TAN buffer. Bands were visualized by Stains-All staining. * This conjugate was loaded into the wells after the indicated time of incubation.

