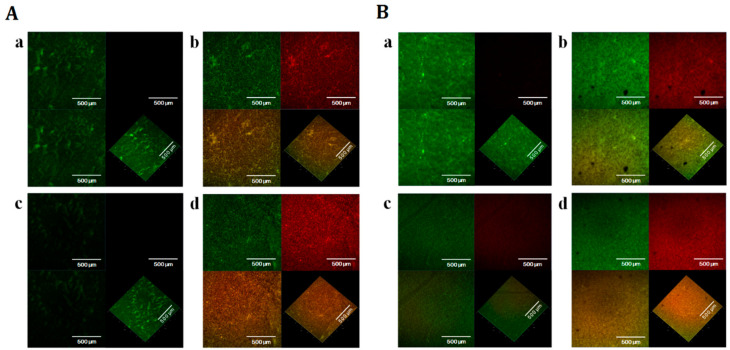
Figure 4.
Effects of HAMA-ERY and GA-AMP combinations on the viability of Escherichia coli ATCC25922 biofilm. The CLSM images of SYTO9- and propidium iodide- stained biofilms after treated with (A) [(a) no drug, (b) HAMA (1× MIC), (c) ERY (1× MIC), (d) HAMA (1× MIC) + ERY (1× MIC)], and (B) [(a) no drug, (b) GA (1× MIC), (c) AMP (1× MIC), (d) GA (1× MIC) + AMP (1× MIC)]. The biofilm cell viabilities were evaluated by using BacLight LIVE/DEAD stain (red: dead cell, green: live cell). In each combined image such as image (a) or (b) or (c) or (d), the top-left image segment shows only the SYTO9-stained green fluorescent cells (live cells), the top-right image segment represents only the propidium iodide-stained red fluorescent cells (dead cells), and the below-left and -right image segments show both the SYTO9-stained green fluorescent cells (live cells) and propidium iodide-stained red fluorescent cells (dead cells) in together. In each combined image, all image segments are shown as two-dimensional except the below-right image segment; only the below-right image segment is represented as three-dimensional. Representative images of Escherichia coli biofilm cells from three independent experiments (n = 3) are presented in this figure. Images shown in this figure are in 50× magnification. AMP, ampicillin; CLSM, confocal laser scanning microscope; ERY, erythromycin; GA, gallic acid; HAMA, hamamelitannin; MIC, minimum inhibitory concentration.

