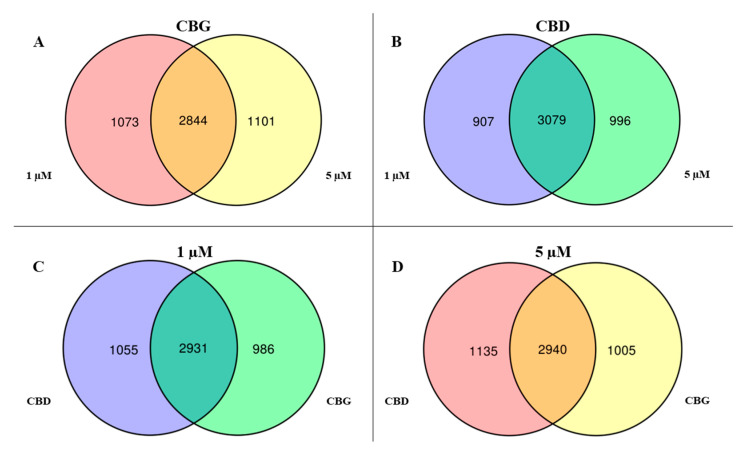
Figure 3.
Venn Diagram. For both the (A) CBG and (B) CBD compound, the central area highlights the amount of genes that are statistically differentially expressed between CTR-NSC-34 and dose 1 and 5 µM of CBG (2844) or CBD (3079). The right areas of both the diagrams highlight the genes statistically differentially expressed between CTR-NSC-34 and dose 5 µM of CBG (1101) or CBD (996) that are not significant at dose 1 µM. Conversely, the left area of the diagrams shows the genes that are statistically differentially expressed between CTR-NSC-34 and dose 1 µM of CBG (1073) or CBD (907) that are not significant at dose 5 µM. For both the (C) 1 and (D) 5 µM doses, the central area highlights the amount of genes that are statistically differentially expressed between CTR-NSC-34 and dose 1 µM of CBD or CBG (2931) or 5 µM of CBG or CBD (2940). The left areas of both the diagrams highlight the genes statistically differentially expressed exclusively between CTR-NSC-34 and dose 1 µM of CBD (1055) or 5 µM CBD (1135). Conversely, the right area of the diagrams shows the genes that are statistically differentially expressed exclusively between CTR-NSC-34 and dose 1 µM of CBG (986) or 5 µM CBG (1005).

