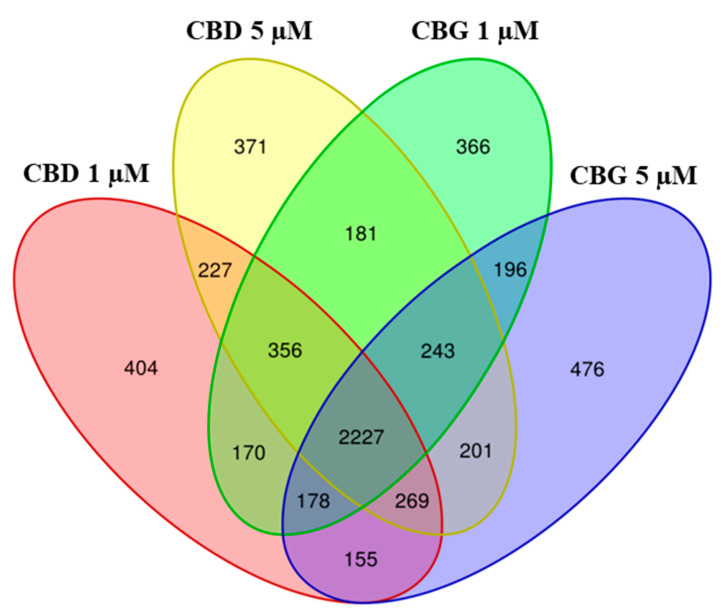
Figure 4.
Venn Diagram. The genes differentially expressed in CBD 1 µM, CBD 5 µM, CBG 1 µM and CBG 5 µM were evaluated. The comparison of all the samples shows how many genes are differentially expressed between the different compounds at each concentration. Each intersection of the different samples shows the number of genes in common, exclusively between those groups and not with the others.

