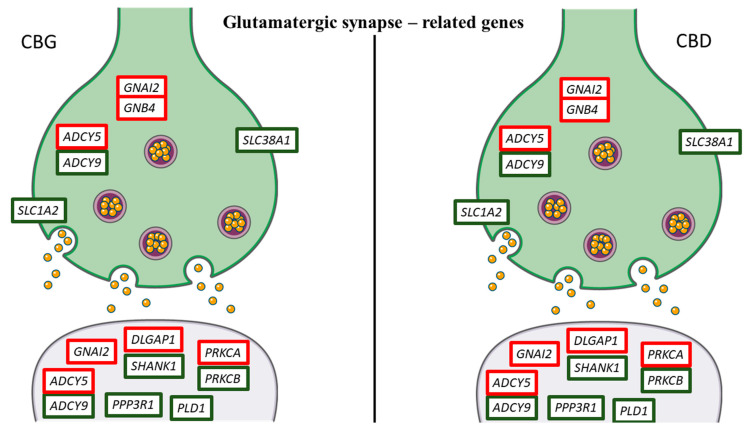
Figure 7.
Genes related to glutamaergic synapse differentially regulated by CBG and CBD. Genes upregulated are represented with the red edges, while the genes downregulated have green edges. Interestingly, CBG and CBD showed the same pattern of gene expression. The figure was created using the vector image bank of Servier Medical Art by Servier [17] and licensed under a Creative Commons Attribution 3.0 Unported License [18].

