Figure 4.
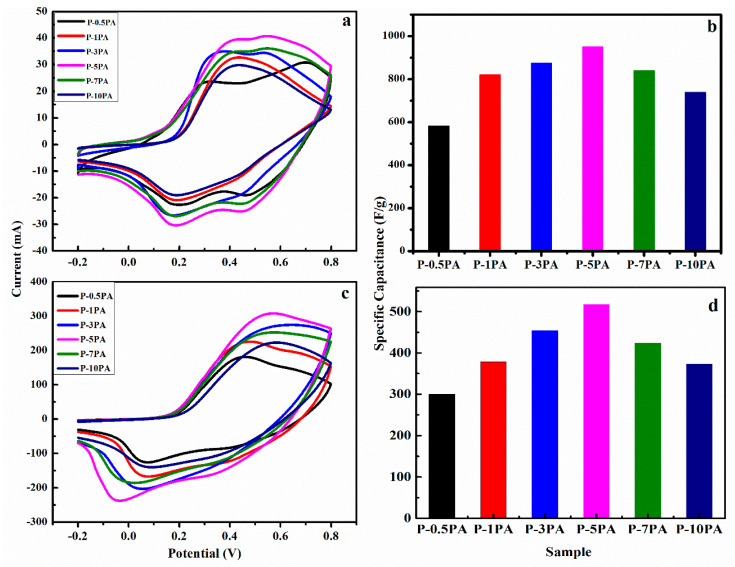
Cyclic voltammetry (CV) curves of various PANI salts in 1 M H2SO4 solution (a) at scan rate of 20 mVs−1; (b) histogram showing Csp values calculated from CV curves at scan rate of 20 mVs−1; (c) at scan rate of 300 mVs−1; (d) histogram showing Csp values calculated from CV curves at scan rate of 300 mVs−1.

