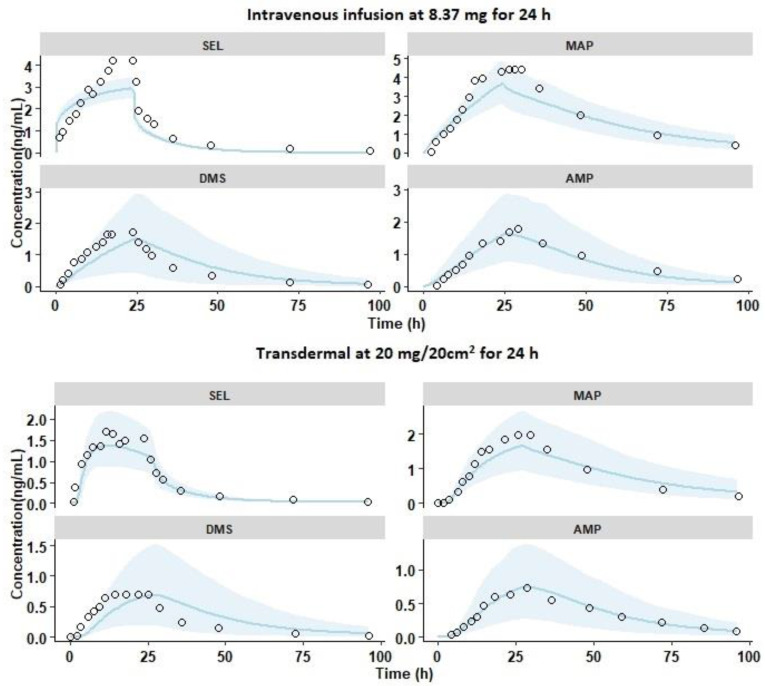
Figure 3.
Overlay plots of observed and predicted mean pharmacokinetic profiles of SEL and its metabolites with 90% prediction interval represented as the shaded area (sky blue). The black open circles represent the mean observed data; the solid lines (sky blue) represent the simulated profiles. The compounds SEL: Selegiline, MAP: Methamphetamine, DMS: Desmethyl Selegiline, and AMP: Amphetamine are shown as faceted plots. The single dose intravenous infusion and transdermal administration of selegiline in healthy male subjects reported by Azzaro et al.

