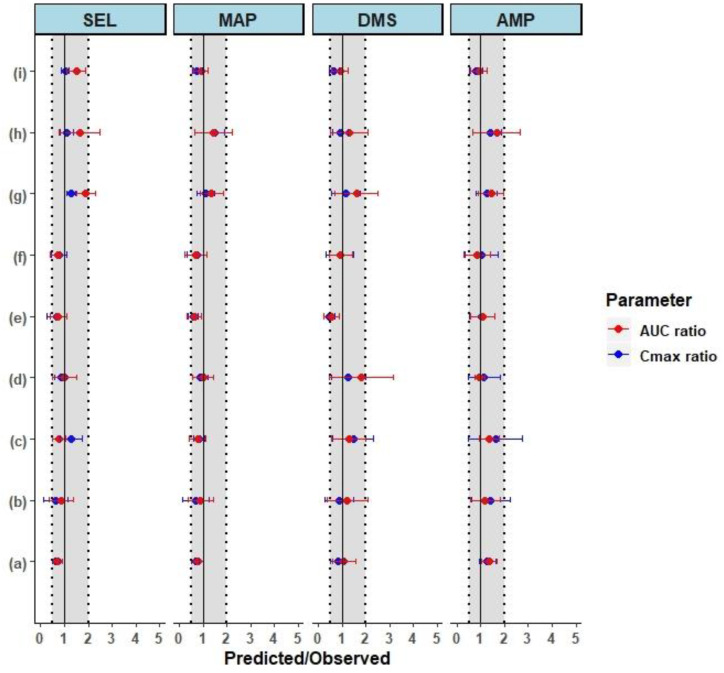
Figure 5.
The forest plot shows the mean ± SD predicted in elderly subjects over the observed ratio of pharmacokinetic parameters in healthy subjects. The dotted and shaded area represents the 0.5- to 2-fold range and the solid black line represents the line of unity. The parameters AUC and Cmax represent the Area Under the Curve 0-t and the maximum plasma concentration, respectively. The compounds SEL: Selegiline, MAP: Methamphetamine, DMS: Desmethyl Selegiline, and AMP: Amphetamine are shown as faceted plots. (a) Intravenous infusion at 8.37 mg/kg for 24 h; (b) single dose Transdermal pharmacokinetics in healthy male adults at 20 mg/20 cm2 for 24 h; (c) single dose Transdermal pharmacokinetics in healthy male and female adults at 20 mg/20 cm2 for 168 h; (d) single dose Transdermal pharmacokinetics in six male healthy adults at 18.3 mg/10 cm2 for 24 h; (e) single dose Transdermal pharmacokinetics in six healthy elderly males at 18.3 mg/10 cm2 for 24 h; (f) single dose Transdermal pharmacokinetics in six healthy elderly males and females at 18.3 mg/10 cm2 for 24 h; (g) multiple dose Transdermal pharmacokinetics in healthy elderly subjects at 7.5 mg/5 cm2/24 h for 10 days; (h) multiple dose Transdermal pharmacokinetics in healthy elderly subjects at 20 mg/20 cm2/24 h for 10 days; (i) multiple dose Transdermal pharmacokinetics in healthy elderly subjects at 30 mg/20 cm2/24 h for 10 days.

