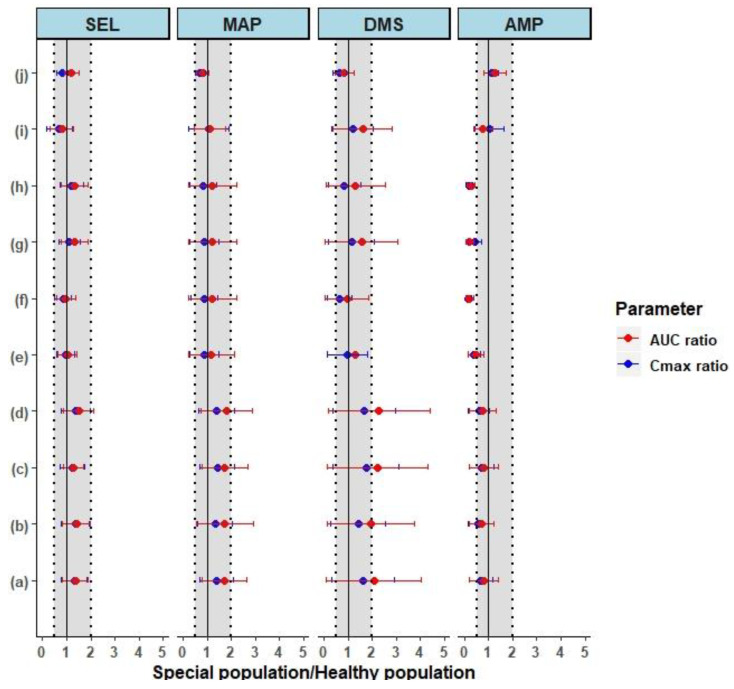
Figure 6.
The forest plot shows the mean ± SD predicted in special populations over the predicted healthy ratio of pharmacokinetic parameters in healthy subjects. The dotted and shaded area represents the 0.5- to 2-fold range and the solid black line represents the line of unity. The compounds SEL: Selegiline, MAP: Methamphetamine, DMS: Desmethyl Selegiline, and AMP: Amphetamine are shown as faceted plots. (a) Single dose Transdermal pharmacokinetics in moderate renally impaired subjects versus healthy adults at 20 mg/20 cm2 for 24 h; (b) single dose Transdermal pharmacokinetics in severe renally impaired subjects versus healthy adults at 20 mg/20 cm2 for 24 h; (c) single dose Transdermal pharmacokinetics in moderate renally impaired subjects versus healthy adults with unbound pharmacokinetic parameters at 20 mg/20 cm2 for 24 h, (d) single dose Transdermal pharmacokinetics in severe renally impaired subjects versus healthy adults with unbound pharmacokinetic parameters at 20 mg/20 cm2 for 24 h; (e) single dose Transdermal pharmacokinetics in moderate Child-Pugh-B hepatic impaired subjects versus healthy adults at 20 mg/20 cm2 for 24 h; (f) single dose Transdermal pharmacokinetics in severe Child-Pugh-C hepatic impaired subjects versus healthy at 20 mg/20 cm2 for 24 h; (g) single dose Transdermal pharmacokinetics in moderate Child-Pugh-B hepatic impaired subjects versus healthy adults with unbound pharmacokinetic parameters at 20 mg/20 cm2 for 24 h; (h) single dose Transdermal pharmacokinetics in severe Child-Pugh-C hepatic impaired subjects versus healthy adults with unbound pharmacokinetic parameters at 20 mg/20 cm2 for 24 h; (i) single dose Transdermal pharmacokinetics in adolescent subjects versus healthy adults at 20 mg/20 cm2 for 24 h; (j) multiple dose Transdermal pharmacokinetics in adolescents versus adult subjects at 20 mg/20 cm2/24 h for 10 days.

