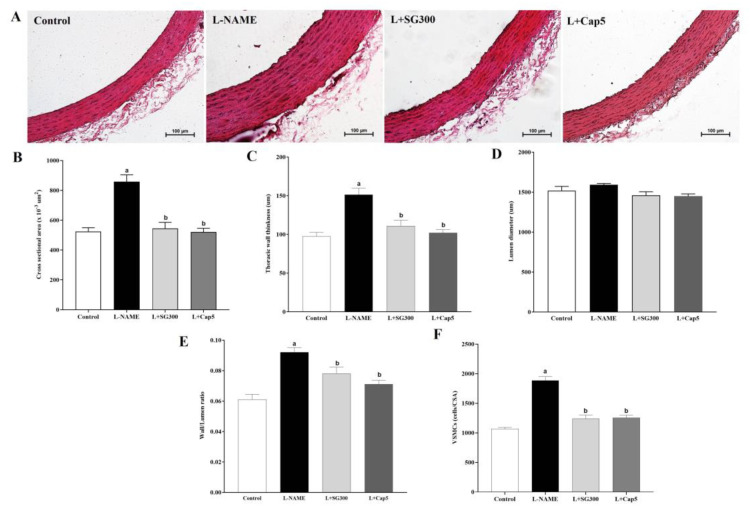
Figure 4.
Morphological changes in aortic hypertrophy in all groups of rats. Illustrative images of thoracic aortas stained by hematoxylin and eosin, original magnification = X 20 (A) and values of cross-sectional areas (B), thoracic wall thicknesses (C), Luminal diameter (D), wall/lumen ratios (E) and vascular smooth muscle cell numbers (F) (n = 6). Data are mean ± SEM, p < 0.05, a < 0.05 vs. control group, b < 0.05 vs. L-NAME group.

