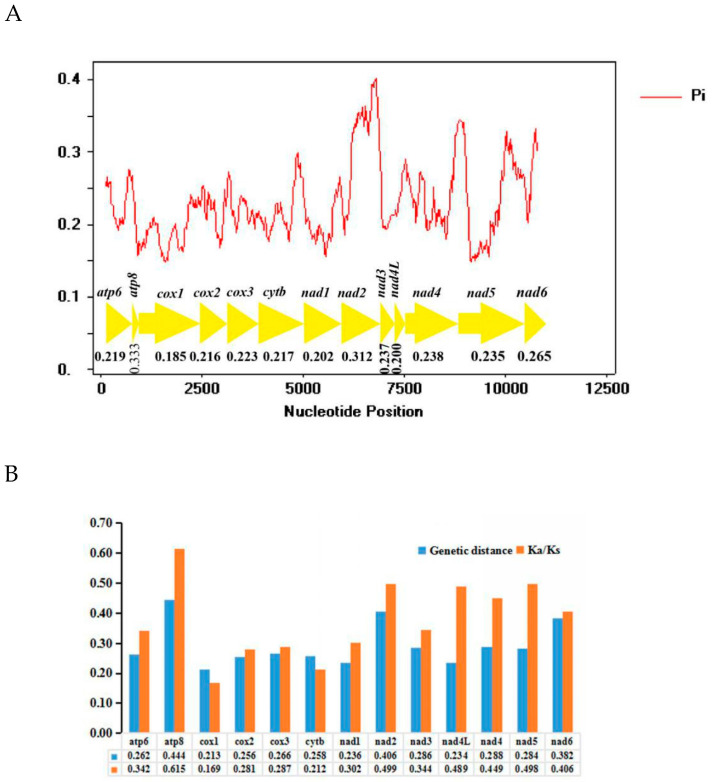
Figure 7.
(A) Sliding window analyses of 13 protein coding genes among 6 species’ mitogenomes. The red line shows the value of nucleotide diversity (Pi) in a sliding window analysis (a sliding window of 200 bp with the step size of 20 bp); the Pi value of each gene is shown under the gene name. (B) Genetic distances and the ratio of non-synonymous (Ka) to synonymous (Ks) substitution rates of 13 protein-coding genes among 6 species of Typhlocybini. The average value for each PCG is shown under the gene name.

