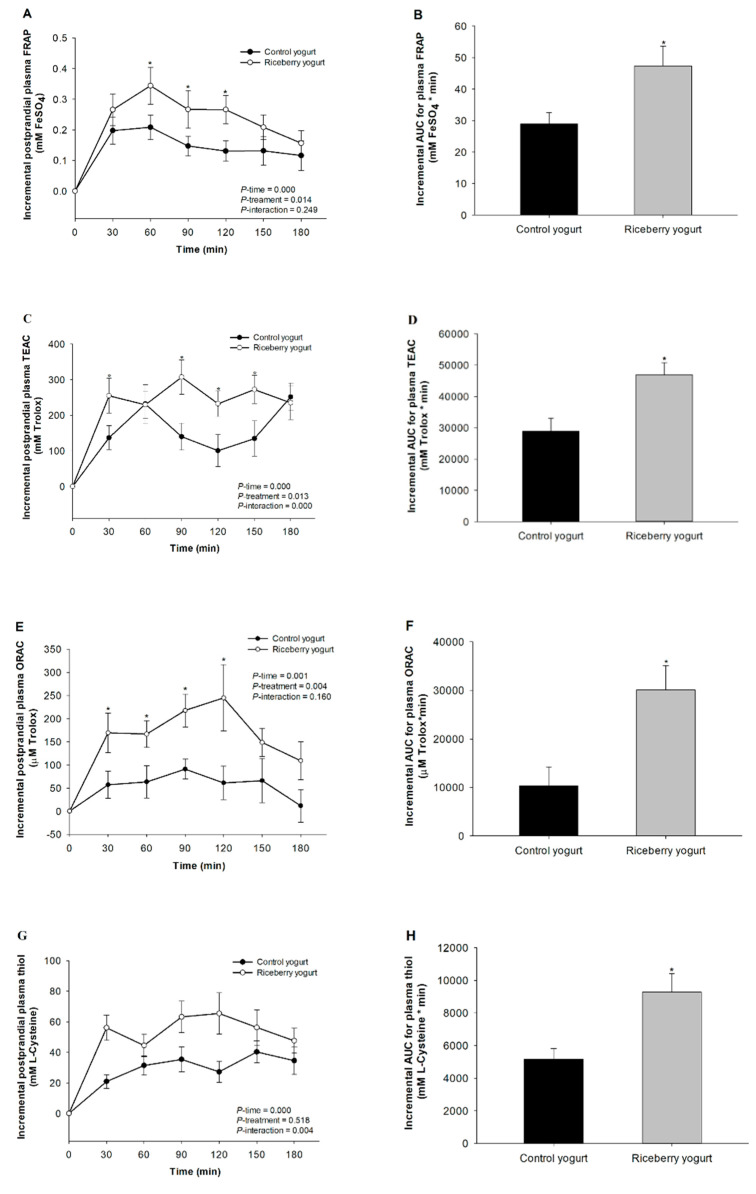
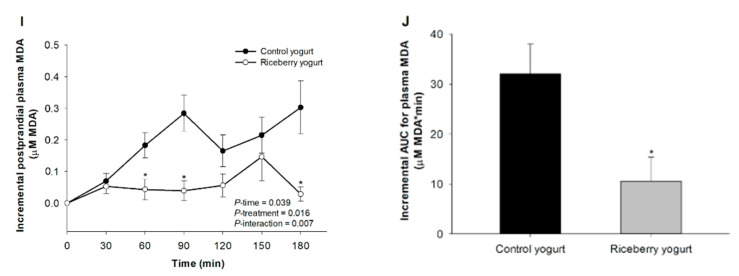
Figure 3.
Incremental changes in postprandial plasma: ferric reducing ability of plasma (FRAP) (A); Trolox equivalent antioxidant capacity (TEAC) (C); oxygen radical absorbance capacity (ORAC) (E); thiol (G); and malondialdehyde concentration (MDA) (I). The incremental area under the curve (iAUC) for postprandial plasma: FRAP (B); TEAC (D); ORAC (F); thiol (H); and MDA (J) in healthy participants after consuming either the control yogurt (●) or riceberry rice yogurt (○). Data are presented as mean ± SEM, n = 19. * p < 0.05 compared to the control yogurt.


