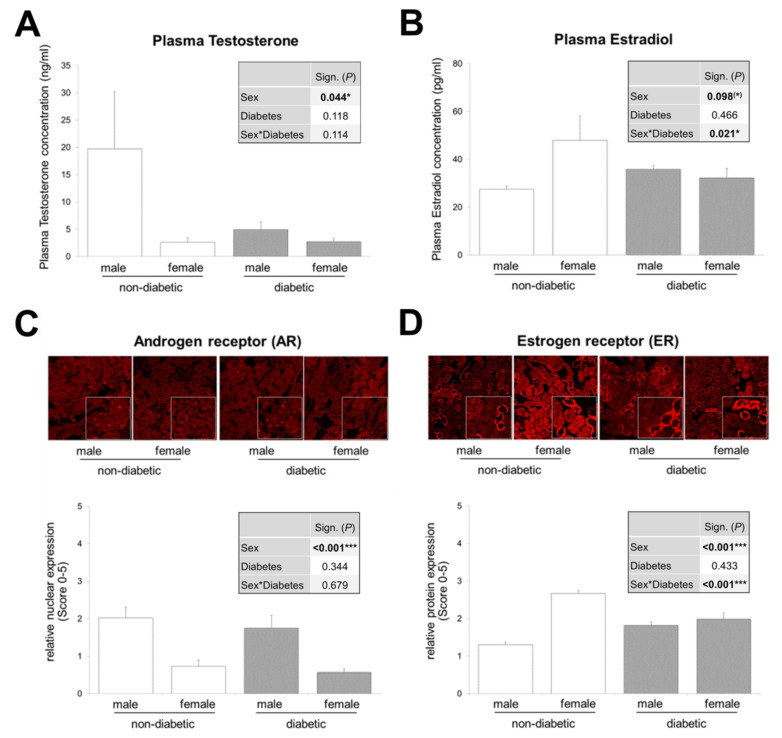
Figure 2.
Sex hormone levels and expression of sex hormone receptors in both sexes of non-diabetic and diabetic mice. (A) Plasma testosterone (n = 5/3/10/8). (B) Plasma estradiol (n = 7/7/11/7). (C) Representative images of androgen receptor (AR) immunofluorescence and quantification of nuclear expression (graph) (n = 10/7/8/5 animals with 10 non-overlapping kidney areas). (D) Representative images of estrogen receptor (ER) immunofluorescence and quantification of expression (graph) (n = 8/7/9/6 animals with 10 non-overlapping kidney areas). (A–D) The significances, shown in the tables (graph inserts), were assessed using two-way ANOVA with sex (male or female) and diabetes (non-diabetic or diabetic) as the two factors. Sex, Diabetes: main effect of sex/diabetes, respectively. Sex*Diabetes: interaction (determines whether the one main effect depends on the level of the other main effect). Magnification of immunofluorescence (200×). * P ≤ 0.05; *** P ≤ 0.001.

