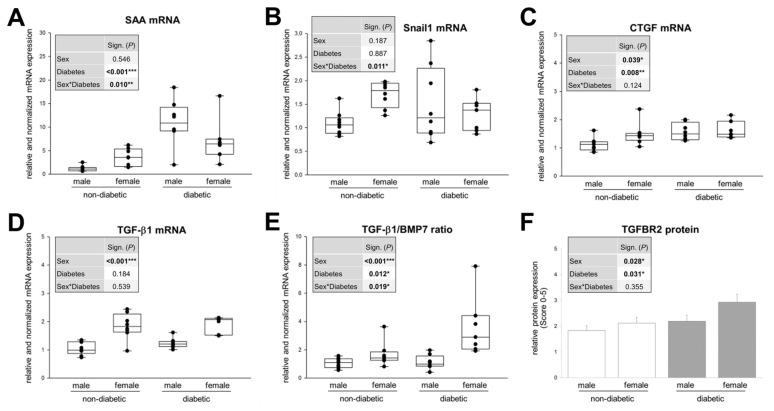
Figure 4.
Expression of molecular markers of TIF in kidney cortex of non-diabetic and diabetic mice. (A) Real-time PCR analysis of SAA (serum amyloid A) mRNA. (B) Real-time PCR analysis of Snail1 mRNA. (C) Real-time PCR analysis of CTGF (connective tissue growth factor) mRNA. (D) Real-time PCR analysis of TGF-β1 mRNA. (E) Ratio of real-time PCR analysis of TGF-β1 and BMP7 mRNA. (A–E) Each point on the graph represents an individual mouse (n = 10/8/8/7). (F) Semi-quantitative analysis of the immunohistochemical staining of TGF-β1 receptor 2 (TGFBR2) (n = 9/7/9/7 animals with 10 non-overlapping kidney areas). (A–F) The significances, shown in the table insert, were assessed using two-way ANOVA with sex (male or female) and diabetes (non-diabetic or diabetic) as the two factors. Sex, Diabetes: main effect of sex/diabetes, respectively. Sex*Diabetes: interaction (determines whether the one main effect depends on the level of the other main effect). * P ≤ 0.05; ** P ≤ 0.01; *** P ≤ 0.001.

