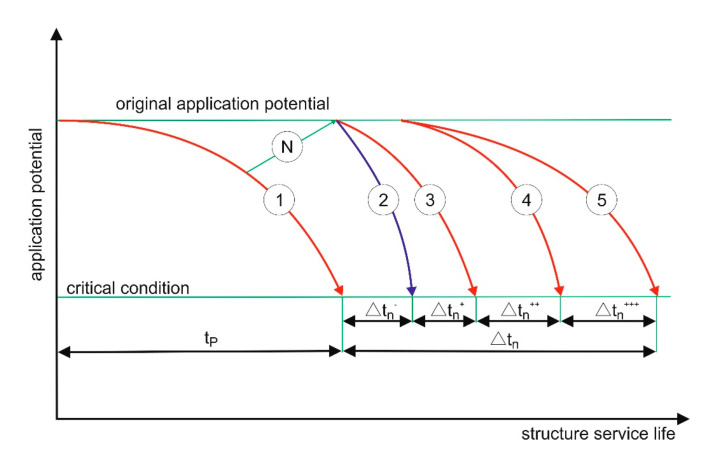
Figure 5.
Schematic presentation of a repair cycle resulting in restoring the use potential: N—repair restoring the original use potential; 1—change in the use potential according to the design model; 2—change in the use potential after the repair, increased degradation rate as a result of new degradation sources triggered by the repair, e.g., electrochemical corrosion; 3—change in the use potential after the repair, unchanged degradation rate; 4—change in the use potential after the repair, degradation rate reduced e.g., as a result of lagging replacement; 5—change in the use potential after the repair, degradation rate additionally reduced by applying a surface protecting coating; tp—designed service life; Δtn-—additional service life gained owing to successful repair, reduced as a result of new degradation sources introduced by the repair; Δtn+—additional service life gained owing to successful repair, degradation rate unchanged; Δtn++—additional service life gained owing to successful repair, degradation rate reduced e.g., as a result of lagging replacement; Δtn+++—additional service life gained owing to successful repair, degradation rate additionally reduced by applying a surface protecting coating.

