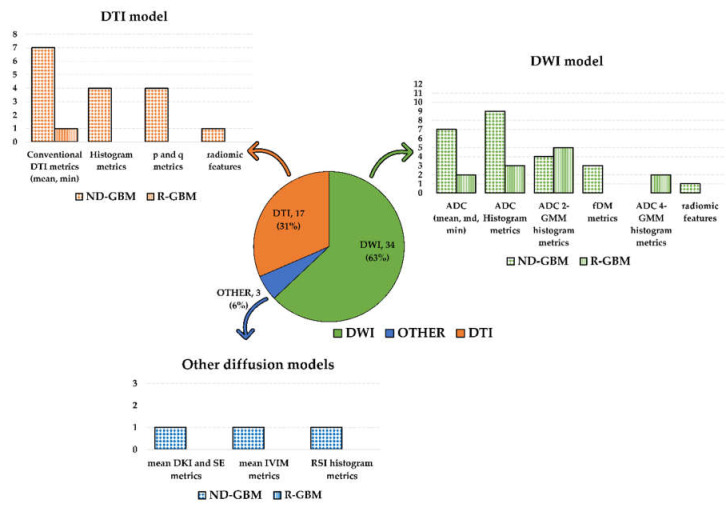
Figure 2.
Graphic summary of the systematic review results according to the diffusion models and metrics investigated in the selected studies. The pie chart shows the number of included studies according to the diffusion MRI model (DWI in green; DTI in orange; other diffusion models in blue). Number and percentage of studies included in each of the three groups were reported. The bar plots show the diffusion metrics investigated in each group. Dotted bars count studies on newly diagnosed GBM patients, while the bars filled with vertical lines count studies on recurrent GBM patients. The study by Wen et al. [55] was counted three times in the DWI model histogram since they investigated both histogram and ADC 2-GMM and fDM metrics.

