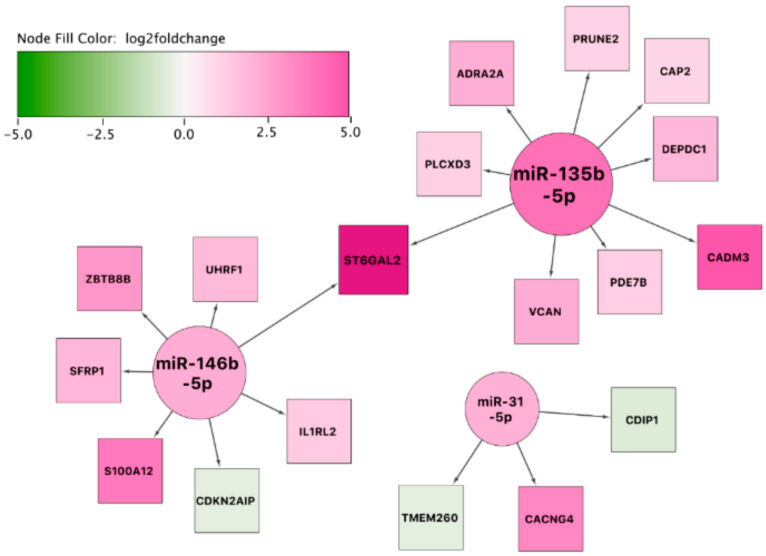
Figure 7.
miRNA-gene interaction network using the set of differentially expressed miRNAs and mRNAs between affected horses in exacerbation and remission. The color of the interior of the nodes represents the reported log2 fold change of the miRNA or gene, the node shape represents the feature type (miRNA: circle, target gene: square), and the node size represents the degree (number of in- and outgoing edges).

