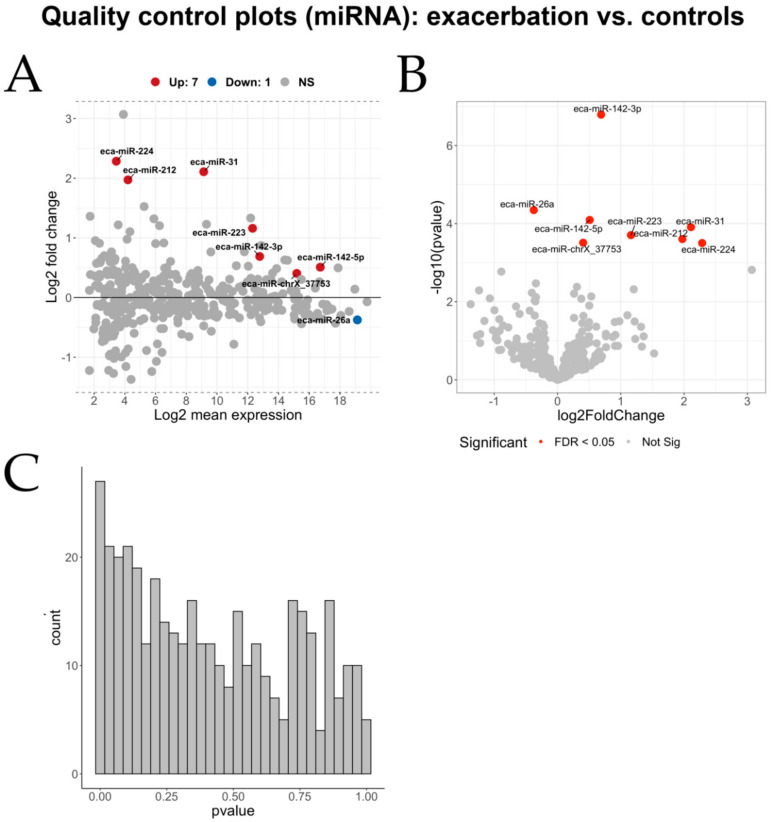
Figure A2.
Quality control plots for the differential miRNA expression analysis using the contrast of horses in exacerbation vs. healthy control horses. An MA-plot (A), a Volcano plot (B), and a histogram of the obtained p-values (C) are shown. Non-significant (NS) miRNAs are indicated in grey color.

