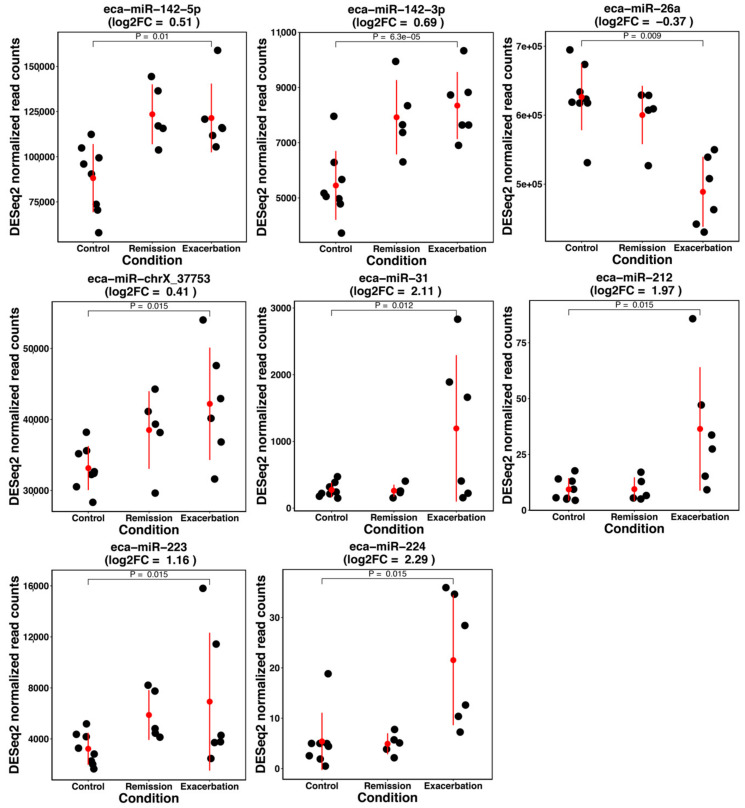
Figure A5.
Obtained normalized read counts for all differentially expressed miRNAs for the contrast exacerbation vs. controls. The red dot indicates the mean expression value and the red bars span the range of plus and minus one standard deviation. Adjusted p-values are listed for the contrast of interest.

