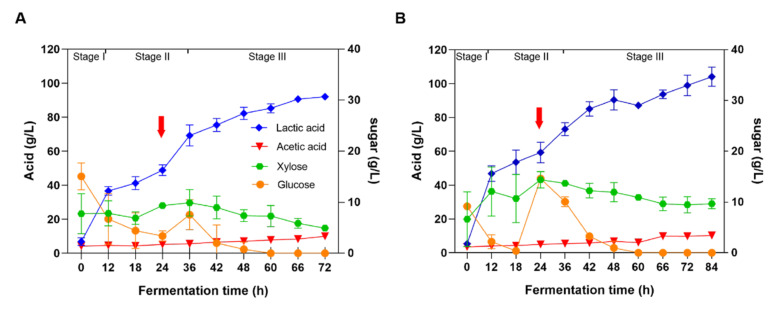
Figure 3.
Lactic acid production from NaOH-pretreated and washed corn stover. (A) Initial 8% (w/w) NaOH-pretreated and washed corn stover was fed with the stover treated in the same manner at hour 24 to reach the final concentration of 12.0% (w/w). (B) Initial 8% (w/w) NaOH-pretreated and washed corn stover was fed with the stover treated in the same manner at hour 24 to reach the final concentration of 15.0% (w/w). Substrate and enzyme feedings are indicated by red arrows. The final cellulase concentration in both experiments was 30 FPU/g stover. Diamonds indicate lactic acid. Inverted triangles represent acetic acid. Dots indicate glucose. Polygons represent xylose. The three fermentation stages are presented in the figures.

