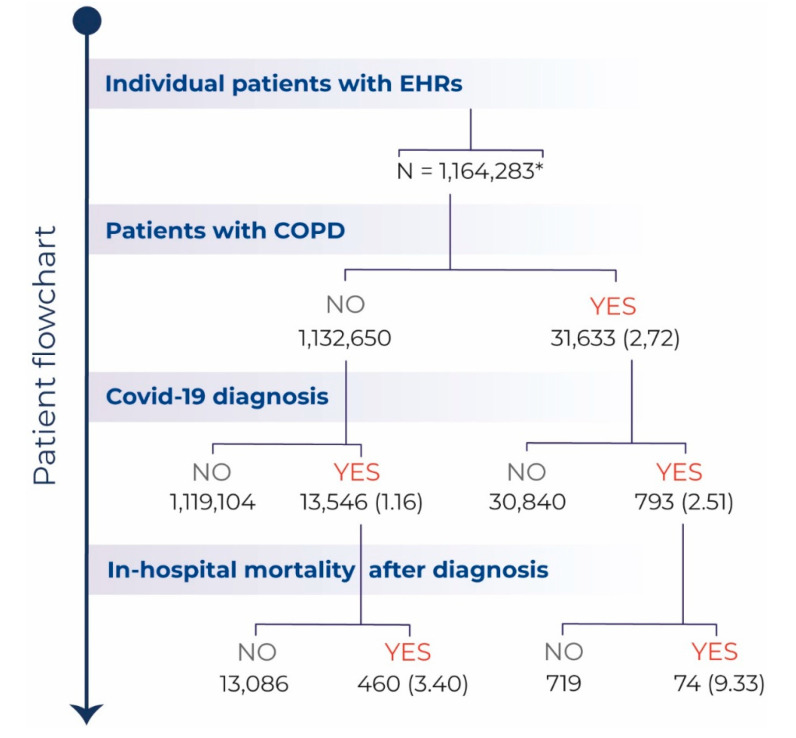
Figure 1.
Patient Flowchart. Flowchart depicting the total number (%) of patients with available electronic health records (EHRs) during the study period (1 January 2019–10 May 2020), the number of patients with COPD seen during this period, the number of patients diagnosed with COVID-19, and of those, the number of deaths after diagnosis. All percent values are computed in relation to the level immediately above. * Patients aged > 40 years.

