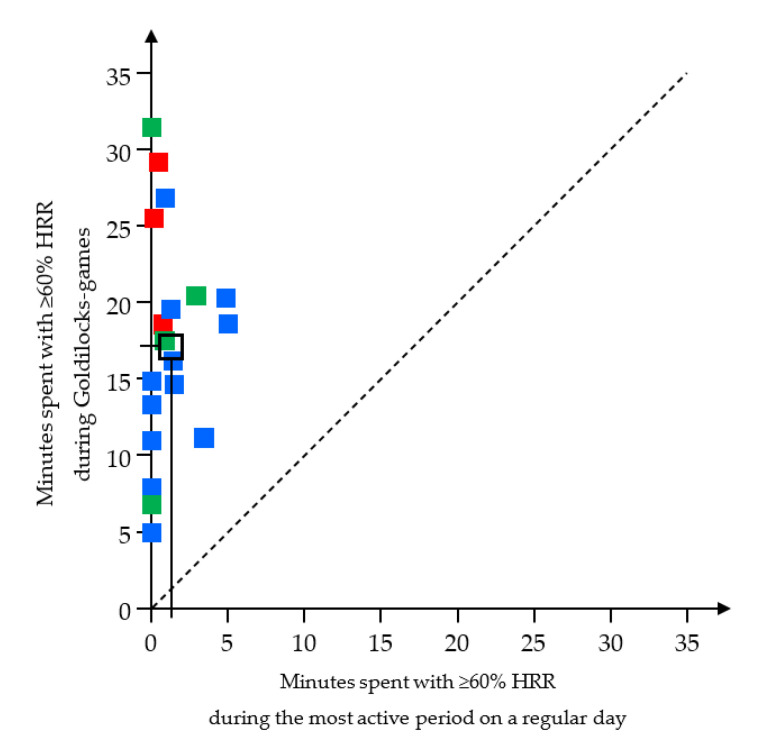
Figure 6.
Minutes spent in HIPA (≥60% HRR) during the most active period in a regular workday (x-axis), and during Goldilocks-games (y-axis). Red, blue and green symbols show values for each individual childcare worker in the ‘below average’, ‘average’ and ‘above average’ fitness groups, respectively; the black square (with vertical and horizontal lines) marks the arithmetic mean of the entire group (n = 19). The dashed line illustrates the line of identity. Abbreviations: HRR, heart rate reserve.

