Figure 6.
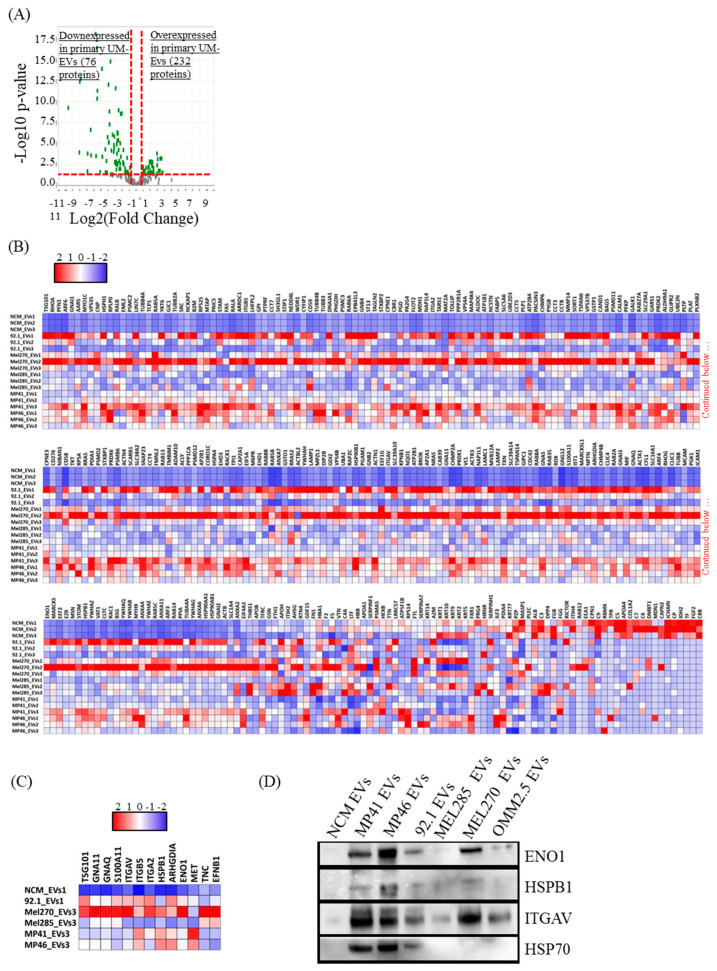
Primary UM-EVs are enriched in proteins involved in the regulation of tumor growth, homeostasis and metastasis organotropism. (A) Volcano plot representation of 308 proteins significantly and differentially expressed between primary UM-EVs and NCM-EVs. (B) Heatmap chart representing the 308 differentially expressed proteins. Note that primary UM-EV contents clustered differently from that of NCM-EVs. The full list of proteins is shown in Table S2. (C) Heatmap chart depicting the relative expression levels of proteins linked to tumorigenesis, cancer homeostasis, and metastasis organotropism. (D) Immunoblot validation of the relative expression levels of some proteins that emerged from MS data mining (see C). Note: HSP90 shown (Figure S7 (E)) was probed on a different membrane. In B,C, the key color represents Log(2) of protein quantitative ration where blue and red refer to downexpressed and overexpressed proteins in UM-EVs, respectively.

