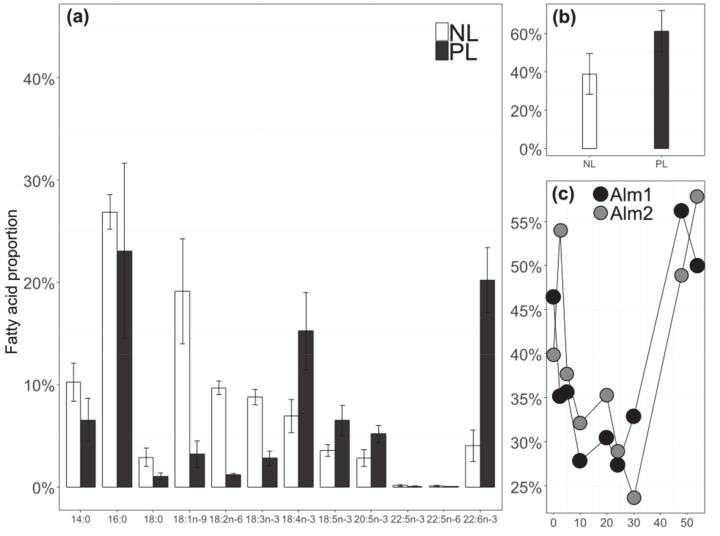
Figure 5.
Proportions of the 12 main fatty acids of A. minutum (mean ± SD of the two enriched balloons over the studied time period between t0 and t54) (a) Mean proportion of neutral lipids (NL) and polar lipids (PL) during the experiment. (b) Variation in NL proportion with time for the two enriched balloons (c).

