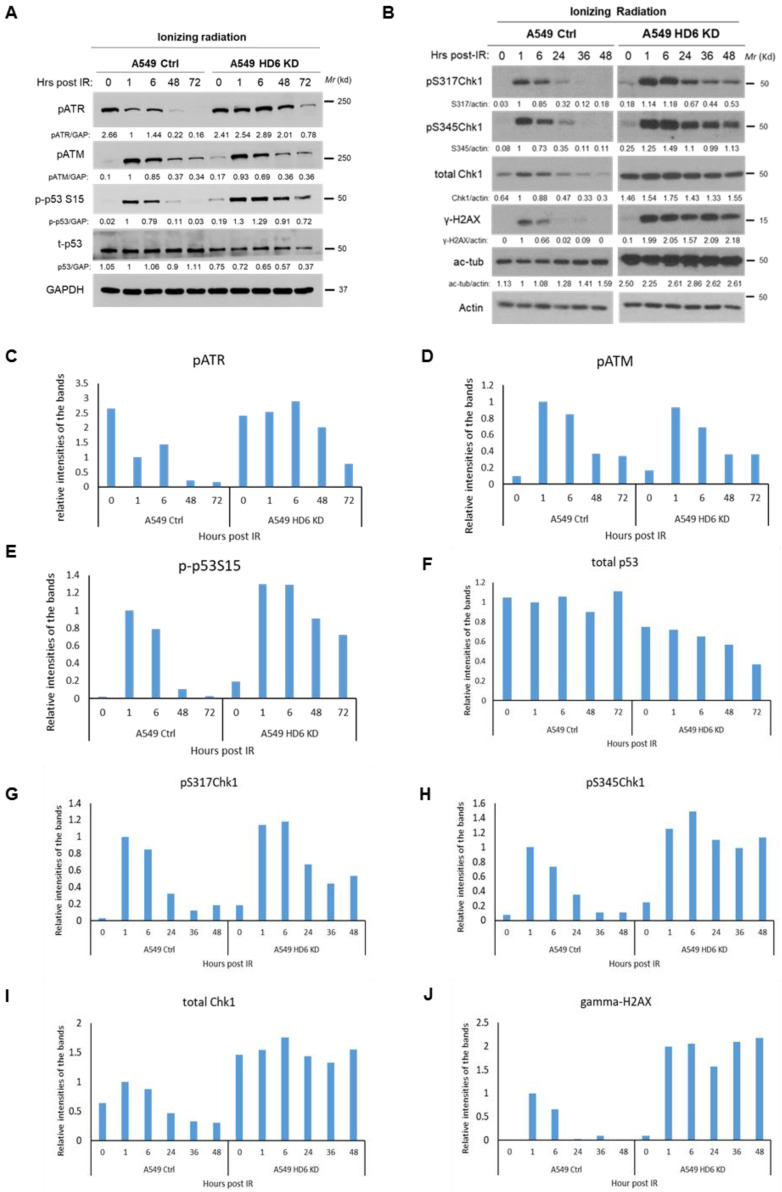
Figure 3.
Examination of DDR markers in A549 control and A549 HDAC6 knockdown cells post-IR. A549 control and HDAC6 knockdown cells were irradiated with a dose of 10 Gy, harvested at the indicated time points, and the lysates were analyzed via Western blot by a series of antibodies: anti-pATR, anti-pATM, anti-p-p53S15, anti-total p53, and anti-GAPDH in (A) or by anti-pS317Chk1, anti-pS345Chk1, anti-total Chk1, anti-γ-H2AX, anti-acetylated tubulin (ac-tub) and anti-actin in (B). Blots were quantified via ImageJ, and reported quantification was normalized to the signal of the A549 control cells 1 h post-IR. The bar graphs for the expression of indicated DDR proteins are shown in (C–J).

