Figure 5.
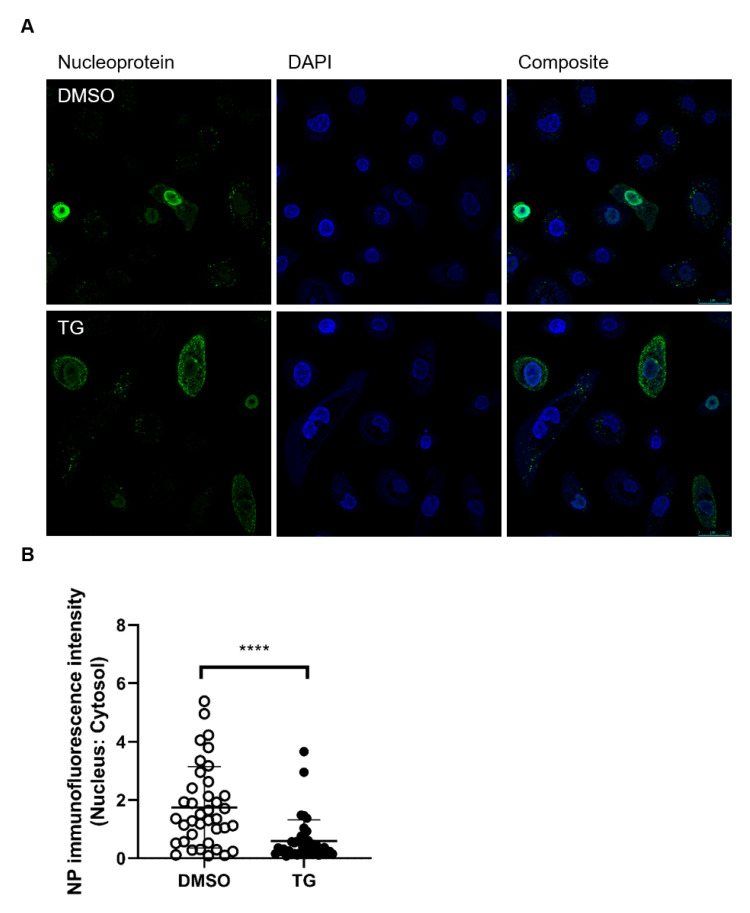
Cytoplasmic NP localisation in TG primed cells. (A) NHBE cells were primed with DMSO or 0.01 μM TG for 30 min, and infected with USSR H1N1 virus at 1.0 MOI for 6 h. Cells were immunostained for viral NP (mouse anti-influenza A virus NP primary antibody detected by donkey anti-mouse IgG H&L conjugated to Alexa Fluor 488 secondary antibody; green fluorescence) and nuclei were stained with DAPI (blue fluorescence). Cells imaged with a Leica TCS SP8 confocal microscope using a 63-time oil immersion objective (scale bar: 25 µm). (B) The ratio of nuclear to cytoplasmic NP fluorescence signal in DMSO and TG-primed NHBE cells was calculated using Fiji (image J). Significance determined by Mann Whitney test, relative to indicated DMSO control. **** p < 0.0001.

