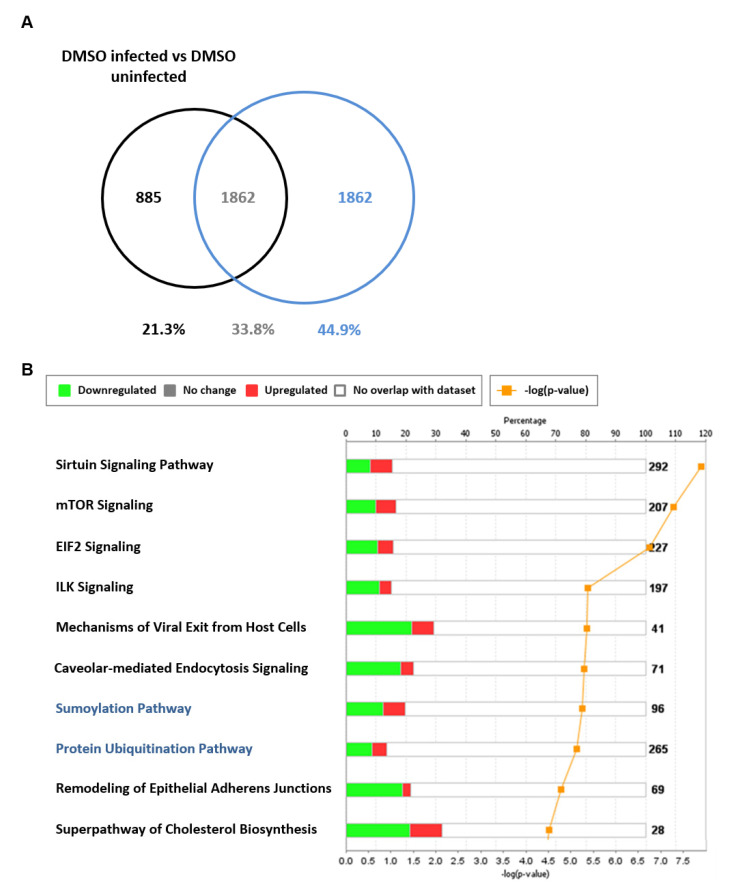
Figure 9.
Differentially expressed genes exclusive to TG-primed and infected NHBE cells. NHBE cells were primed with 0.01 µM TG for 30 min, washed with PBS and infected with USSR H1N1 virus at 0.8 MOI for 12 h for RNA-seq followed by IPA analysis. (A) Differentially expressed genes (1862 transcripts) in NHBE cells in response to infection (based on filtering parameters of q < 0.05 and log2-fold-change < −1 and > +1) were identified as exclusive to TG-primed and infected NHBE cells (i.e., [TG-primed infected/TG-primed uninfected] less (DMSO infected/DMSO uninfected)). (B) Protein sumoylation and ubiquitination (highlighted blue) were among the enriched canonical pathways represented in the 1862 transcripts (based on filtering parameters of q < 0.05 and log2-fold-change < −1 and > +1) exclusive to TG-primed and infected NHBE cells. The stacked bar chart displays the percentage of significant differentially expressed genes that are upregulated (red) or downregulated (green) in each canonical pathway. The number of genes within the pathway recognised by IPA indicated by the numbers to the right of the bars. Orange line represents the −log p-value, indicating the statistical significance of the over-represented canonical pathway.

