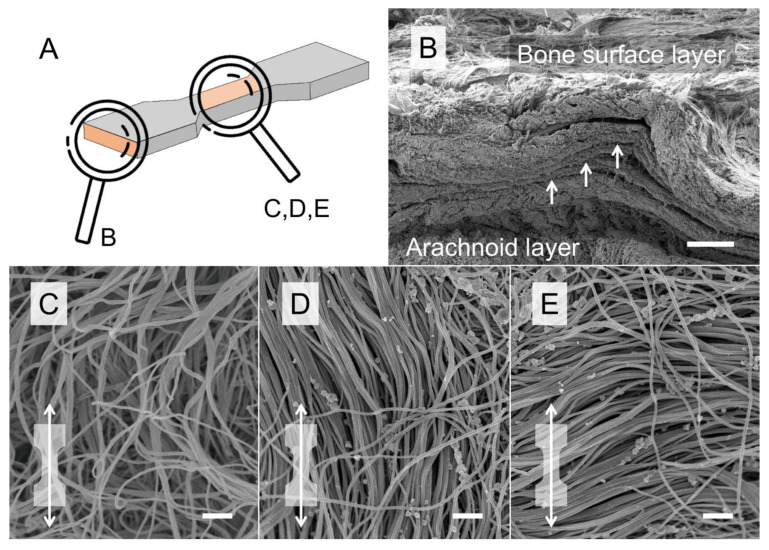
Figure 6.
Representative scanning electron microscopy (SEM) images of the human temporal dura mater (DM) are depicted. (A) Scanning orientation of samples B–E, (B) a cross-sectional SEM scan is depicted showing the multi-layered organization of the human DM. Scale bar, 100 μm. (C–E) SEM scans of the DM bone surface layer reveal isotropic (C) and anisotropic (D,E) areas. The dog bone shape with the white arrow indicates that samples are strained along the axis (D) or perpendicular to the axis (E) of aligned collagens within the shaft area of the dog bone-shaped sample during tensile tests. Scale bars, 1 μm.

