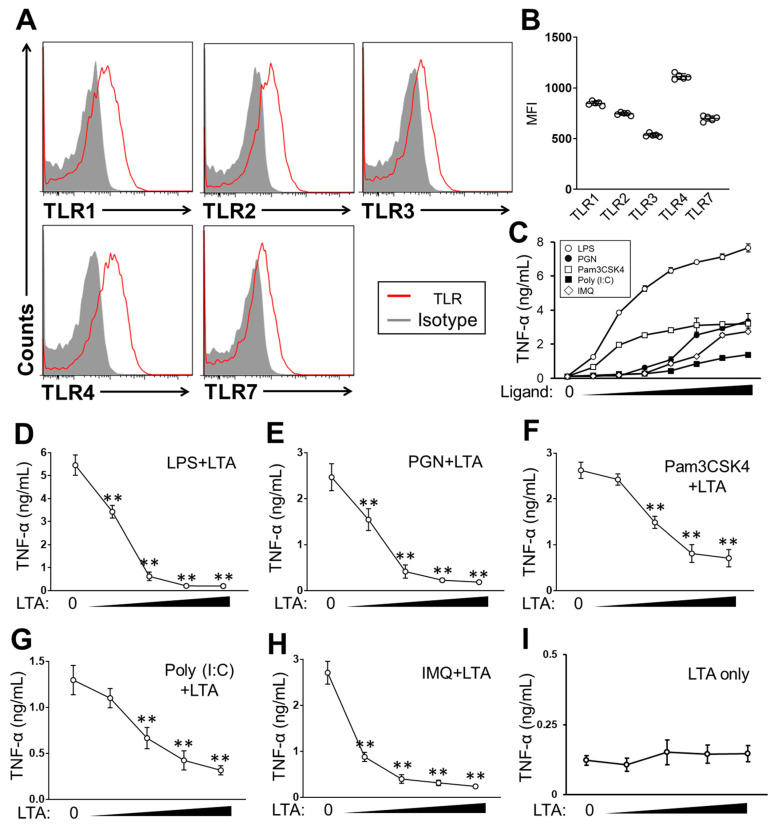
Figure 1.
LTA suppresses TLR-dependent cytokine production in (BMDCs). (A, B) The characterization of TLR expression in BMDCs. TLR1, 2, 3, 4 and 7 were analyzed by flow cytometry. The representative image (A) and the mean fluorescence intensity (MFI) (B) of each TLR expression in the analysis. (C) BMDCs were stimulated with TLR ligands at 37 °C for 24 h, then the TNF-α production was measured by ELISA. Ligand concentration was 0.01, 0.05, 0.1, 0.5, 1, 5 and 10 ug/mL, respectively. (D–I) BMDCs were stimulated with TLR ligand in the presence or absence of LTA (D–H). Some cells were treated with LTA-only (I). The concentration of TLR ligand was LPS: 100 ng/mL, PGN: 10 ug/mL, Pam3CSK4: 100 ng/mL, Poly (I:C): 10 ug/mL or IMQ: 10 ug/mL, respectively. LTA concentration was 0.1, 0.5, 1 and 5 ug/mL at each point. The culture was incubated at 37 °C for 24 h, then, the TNF-α production was measured by ELISA. Data are shown as the mean ± SEM of at least five samples in independent experiments. Student’s t-test was used to analyze data for significant differences. Values of ** p < 0.001 were regarded as significant.

