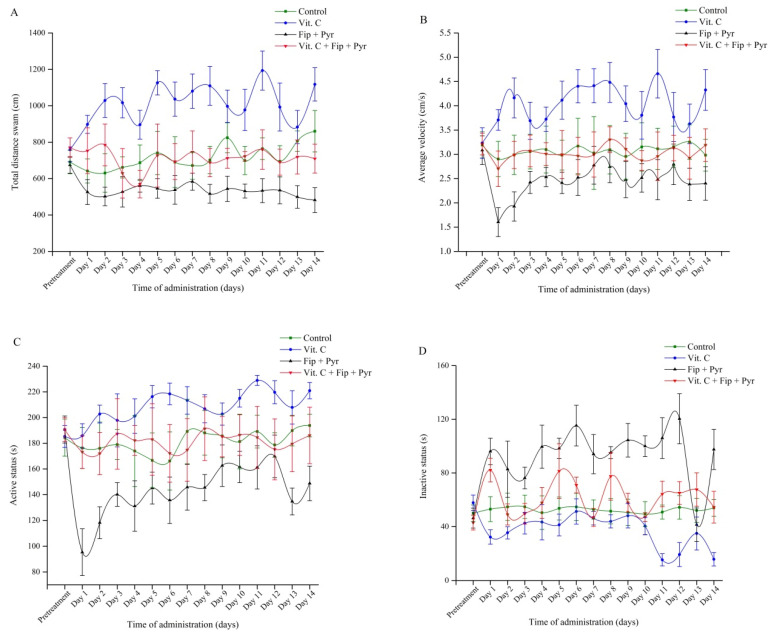
Figure 2.
Zebrafish juvenile swimming performance test results during the experiment (n = 45 per group combined with triplicates experiments). (A) Total distance swam (cm). (B) Average velocity (cm/s). (C) Active status (s). (D) Inactive status (s). Green: control group, Blue: Vit. C group (14 d. 25 µg L−1), Black: insecticide mixture group (600 µg L−1 Fip + 600 µg L−1 Pyr), Red: insecticide mixture and vit. C group (14 d. [600 µg L−1 Fip + 600 µg L−1 Pyr] + 25 µg L−1 vit. C). The groups were compared to pretreatment days and the results were represented as average ± SD.

