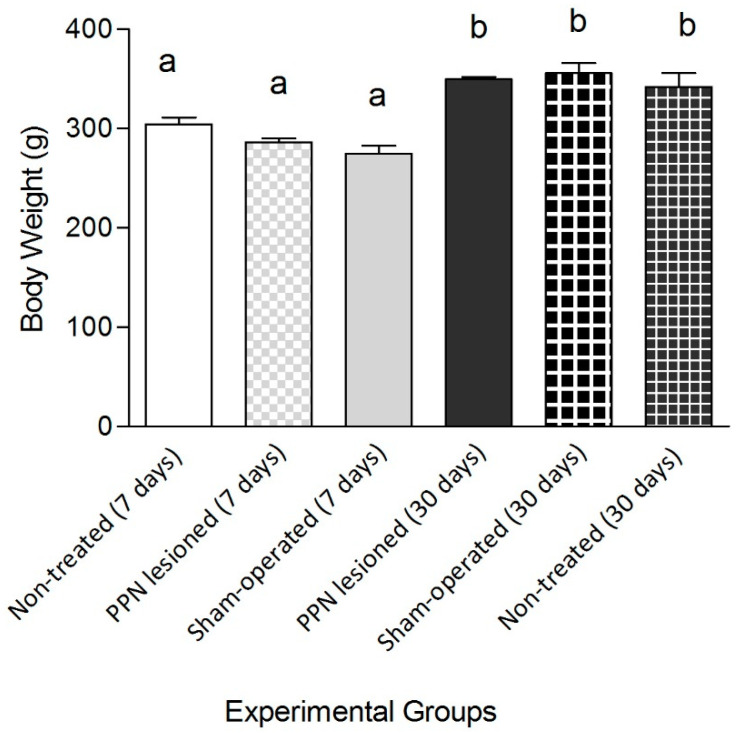
Figure 3.
Comparative study of the body weight between experimental groups. The analysis of the body weight showed significant differences between experimental groups (F(5, 65) = 17.11 p ≤ 0.001). The body weight segregated the groups where the behavioral study was carried out seven and 30 days after pedunculopontine nucleus lesion. One-way ANOVA test. a vs. b: p < 0.01. The bars represent X ± E.E.M.

