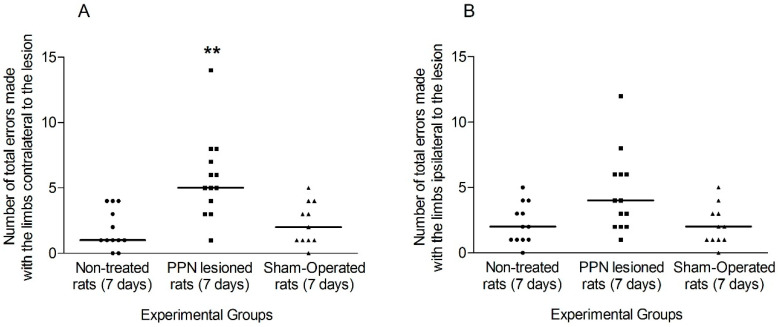
Figure 5.
Comparison of the total faults made by the limbs of each side during the execution of Grid Test seven days after pedunculopontine nucleus lesion. (A) Faults exhibited by the contralateral limbs (H(2, 38) = 12.34 p < 0.01). (B) Faults corresponding to ipsilateral limbs (H(2,38) = 5.00 p > 0.05). Kruskal–Wallis test. ** p < 0.01. The points represent the number of errors of each experimental subject. The horizontal lines represent the median of each sample.

