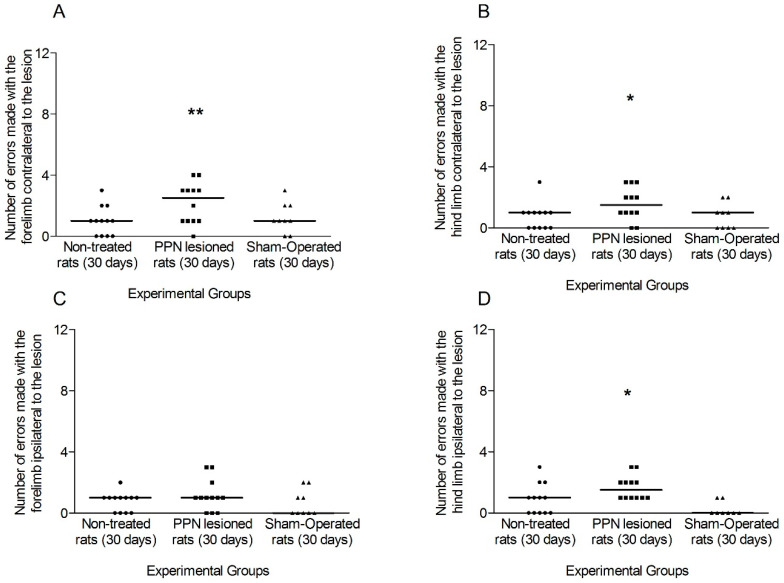
Figure 8.
Comparison of the faults made by each limb separately during the execution of grid test, 30 days after pedunculopontine nucleus lesion. (A) Faults made by the contralateral forelimb (H(2,33) = 9.65 p < 0.01). (B) Faults corresponding to contralateral hind limb (H(2,33) = 8.03 p < 0.05). (C) Faults made by the ipsilateral fore limb (H(2,33) = 1.42 p > 0.05) (D) Faults corresponding to ipsilateral hind limb (H(2,33) = 4.90 p < 0.05). Kruskal–Wallis test. * p < 0.05, ** p < 0.01. The points represent the number of errors of each experimental subject. The horizontal lines represent the median of each sample.

