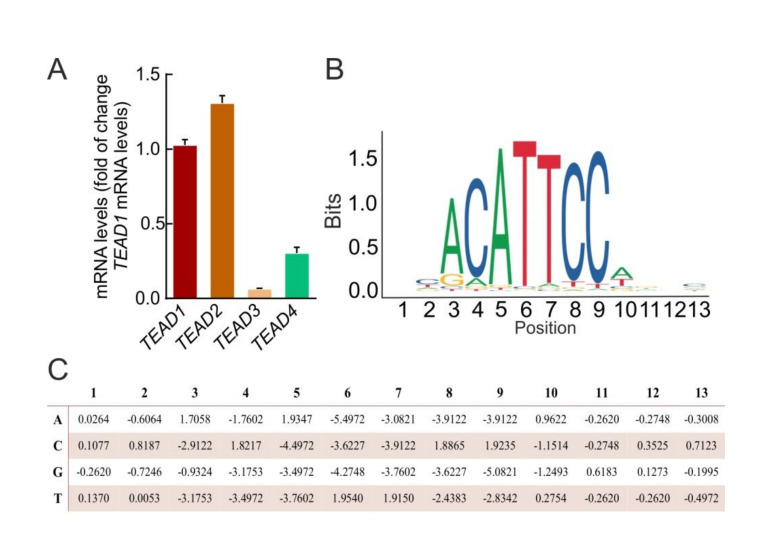
Figure A4.
TEADs expression in ReNcells VM and JASPAR-based analysis of the consensus TEAD binding sequences. (A) mRNA levels of the TEADs 1 to 4 were determined by qRT-PCR and normalized to the levels of TEAD1. mRNA levels were determined by qRT-PCR and normalized by the geometric mean of ACTB, GAPDH and TBP levels. Data represent mean ± S.D. (n = 4). (B) TEAD2 motif from JASPAR database indicating its consensus binding profile. (C) Position specific scoring matrix (PSSM) for TEAD2 PSSM derived from the frequency matrix available in JASPAR database (PSSM or TEAD1, TEAD3 and TEAD4 are available upon request).

