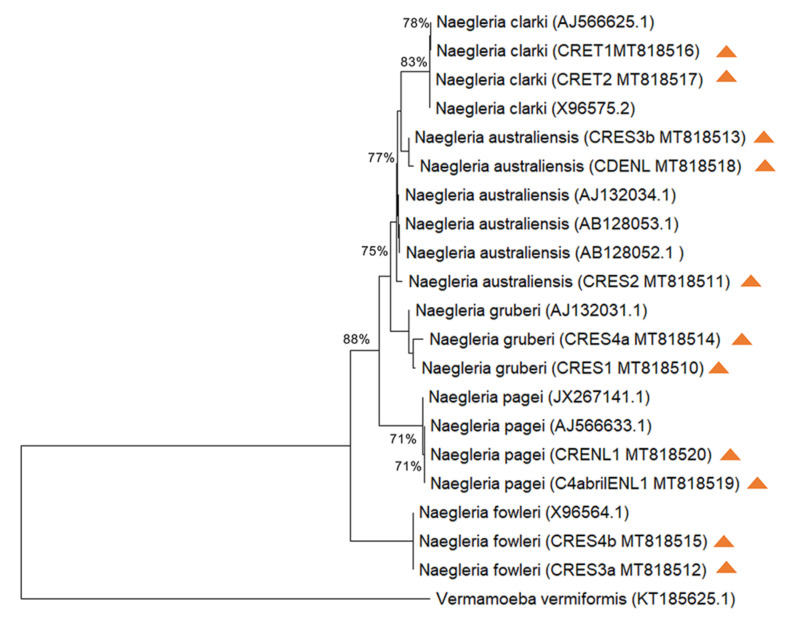
Figure 3.
Neighbor-Joining tree depicting the relationships between the isolates with reference strains of Naegleria for ITS1, 5.85 and ITS2 sequences. The numbers on the tree branches are the percentages of bootstrap values. Bootstrap values (1000 replicates) are indicated for the nodes gaining more than 50% support. Symbols of different colors represent the isolates. Vermamoeba vermiformis was used as the outgroup. Orange triangles represent each isolate with their GenBank accession number.

