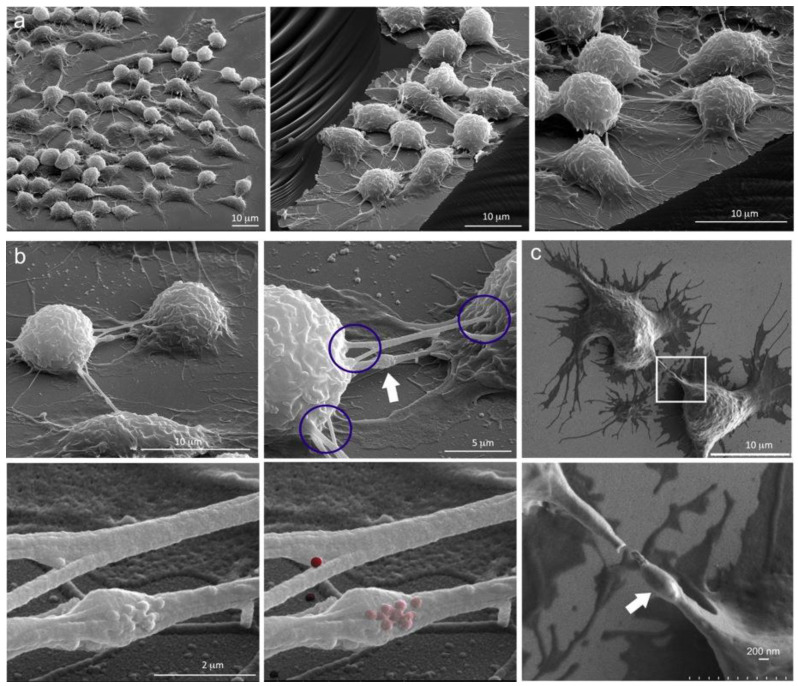
Figure 3.
Macrophage TNTs and gondolas. (a) Three unique SEM images showing cellular connections among RAW 264.4 cells at increasing magnifications. (b) Series of four SEM images showing RAW cells at increasing magnification emphasizing disparate sites of connectivity (circled) and the presence of a gondola within a TNT (white arrow, top right). MSN on the surface of a TNT is shown in grayscale or pseudo-colored red in the lower images (1 h post addition). (c) Two macrophages connected by a TNT (low and high magnification). A gondola is highlighted using in the magnified region (white arrow).

