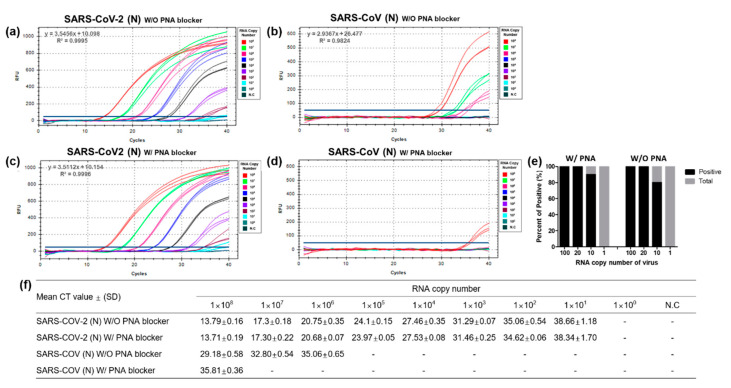
Figure 3.
Optimization and evaluation of the peptide nucleic acid (PNA)-mediated RT-qPCR assay for N gene-specific amplification. Ten-fold serial dilutions (1 × 100 to 1 × 10⁸ per 3 μL) of RNA transcripts of SARS-CoV-2 and SARS-CoV N genes without (a,b) and with (c,d) PNA blocker were processed in triplicates for RT-qPCR optimization. Each dilution was labeled with different colors to identify differences in the amplification curve, as shown in the figure. (e) Limit of detection in 20 repetitions using diluted RNAs (100, 20, 10, and 1 RNA copy numbers per 3 μL). (f) RT-qPCR-positive amplification was determined from the mean cycle threshold value for each RNA dilution point. N.C: negative control; Ct: cycle threshold; SD: standard deviation; “-”: not determined.

