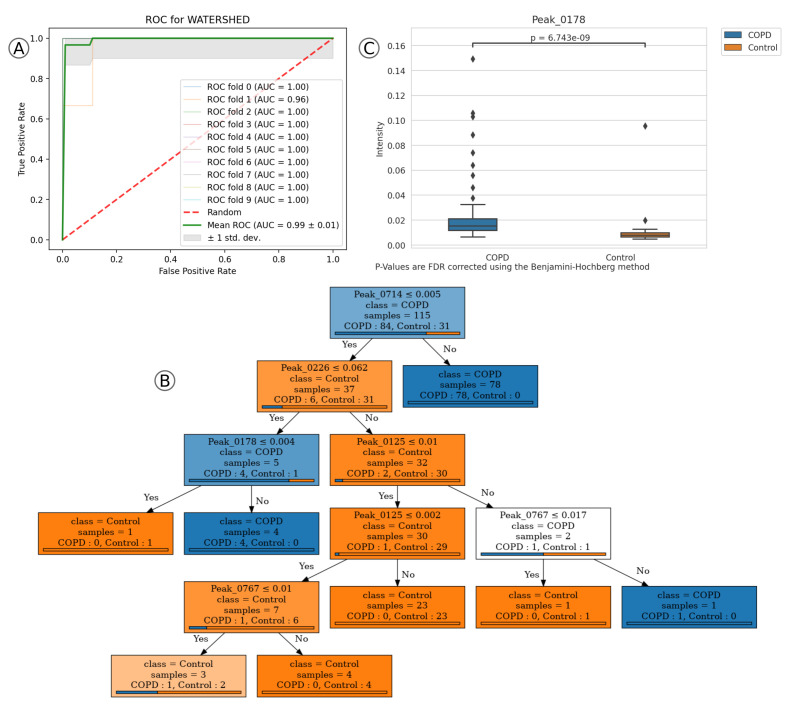
Figure 3.
Receiver operating characteristic (ROC), boxplot and decision tree of top features of prediction model WATERSHED in “COPD” dataset. (A) ROC curve during the ten-fold cross validation. (B) Decision tree based on the highest ranked features from random forest classification. (C) Boxplot of Peak_0178 intensities.

