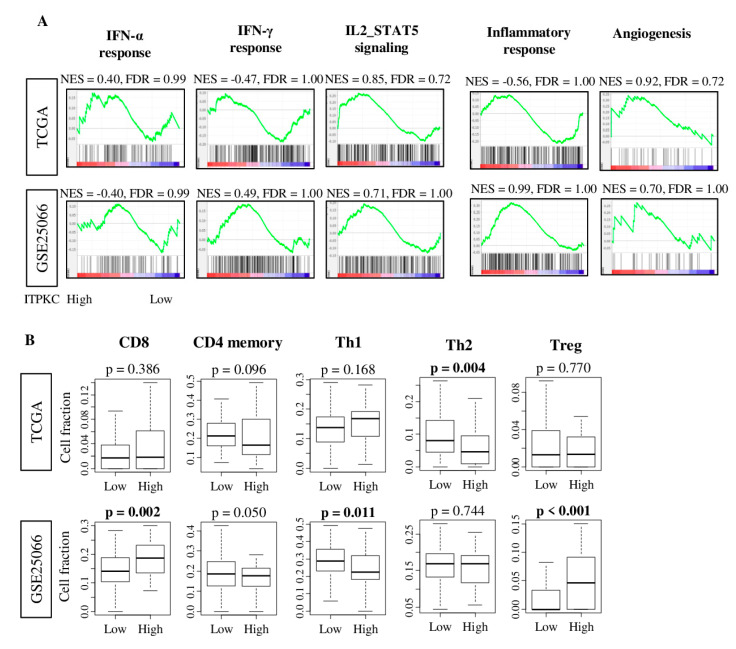
Figure 3.
ITPKC gene expression and immune function and immune cell fraction with TNBC in the TCGA and GSE25066 cohorts. (A) Correlation plots of immune-related gene sets: interferon (IFN)-α and γ, IL2-STAT5 signaling, IL6/JAK/STAT3 signaling, inflammatory response and angiogenesis, with normalized enrichment score (NES) and false discovery rate (FDR). FDR < 0.25 is considered to be statistically significant. (B) Boxplots of the comparison with CD8, CD4 memory, T helper type 1 cells (Th1), T helper type 2 cells (Th2) and regulatory T cell (Treg), by low and high ITPKC expression in both cohorts. The top quartile was defined as the high-score group within each TNBC cohort. One-way ANOVA test was used to calculate p values. Tukey-type boxplots show median and inter-quartile level values.

