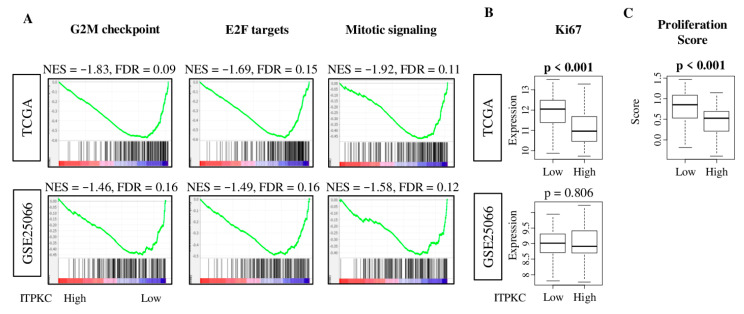
Figure 4.
Hallmark gene sets with significant enrichment in low-ITPKC group of TNBC in both TCGA and GSE25066 cohorts. (A) Gene set enrichment plots along with NES and FDR of gene sets: G2M checkpoint, E2F targets and mitotic signaling. NES and FDR were determined with the classical GSEA method. (B) MKI67 gene expression in the low- and high-ITPKC expression groups of both cohorts. (C) Boxplots of proliferation score between low and high ITPKC expression in the TCGA cohort. The top quartile was defined as the high-score group within each cohort. One-way ANOVA test was used to calculate p values. Tukey-type boxplots show median and inter-quartile level values.

