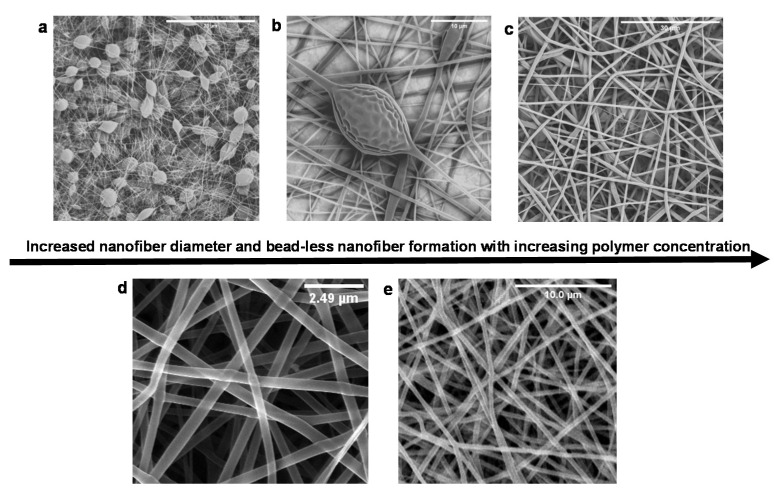
Figure 4.
Scanning electron micrograph of electrospun nanofibers. (a,b) Beaded fibers are formed at low concentrations: (a) 10% and (b) 15%. (c) Bead-less nanofibers were formed at higher concentrations 20%. (d): The critical entanglement concentration was noted at 18% PLGA. (e) The incorporation of NAC in the nanofibers did not alter nanofiber formation at 18%.

