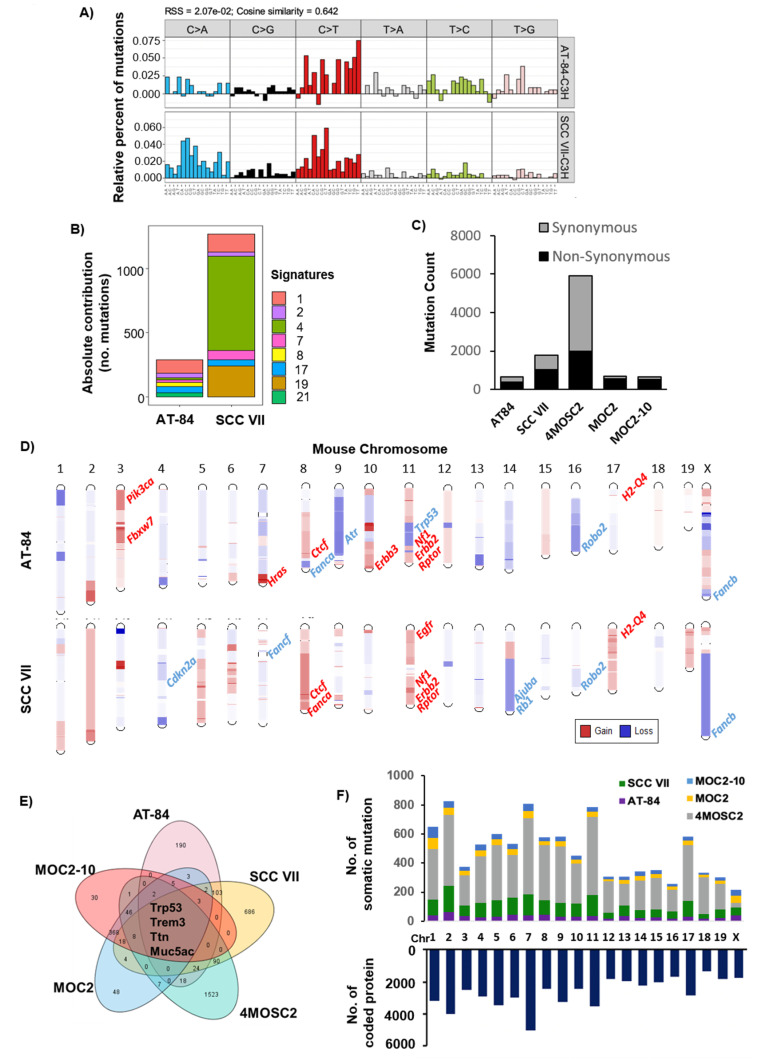
Figure 1.
Comprehensive characterization of mouse head and neck cancer (HNC) models. (A) Mutational spectrum of all base substitutions of AT-84 and SCC VII. Different substitutional types are indicated in the vertical axes. (B) Mutation signatures of AT-84 and SCC VII. Bar plot showing the contribution of Catalogue of Somatic Mutations in Cancer (COSMIC) mutational signatures to reconstructing 96 mutational profiles. Color-coded columns represent different COSMIC signatures according to the legend on the right. (C) Bar plots showing mutation rates of AT-84, SCC VII, MOC2, MOC2-10, and 4MOSC2, respectively. The total number of synonymous and non-synonymous mutations are shown in grey and black bars, respectively. (D) Chromosomal gains (red) and losses (blue) in AT-84 and SCC VII. Some key HNC tumor-related genes are labeled. (E) Venn diagram showing overlapping somatic non-synonymous mutations among 5 mouse models, with numbers indicating somatic non-synonymous mutation number in each model. (F) Distribution of mutational events across mouse chromosomes with different colors representing events from different models (upper panel). The numbers of coding proteins in each mouse chromosome are shown (lower panel).

