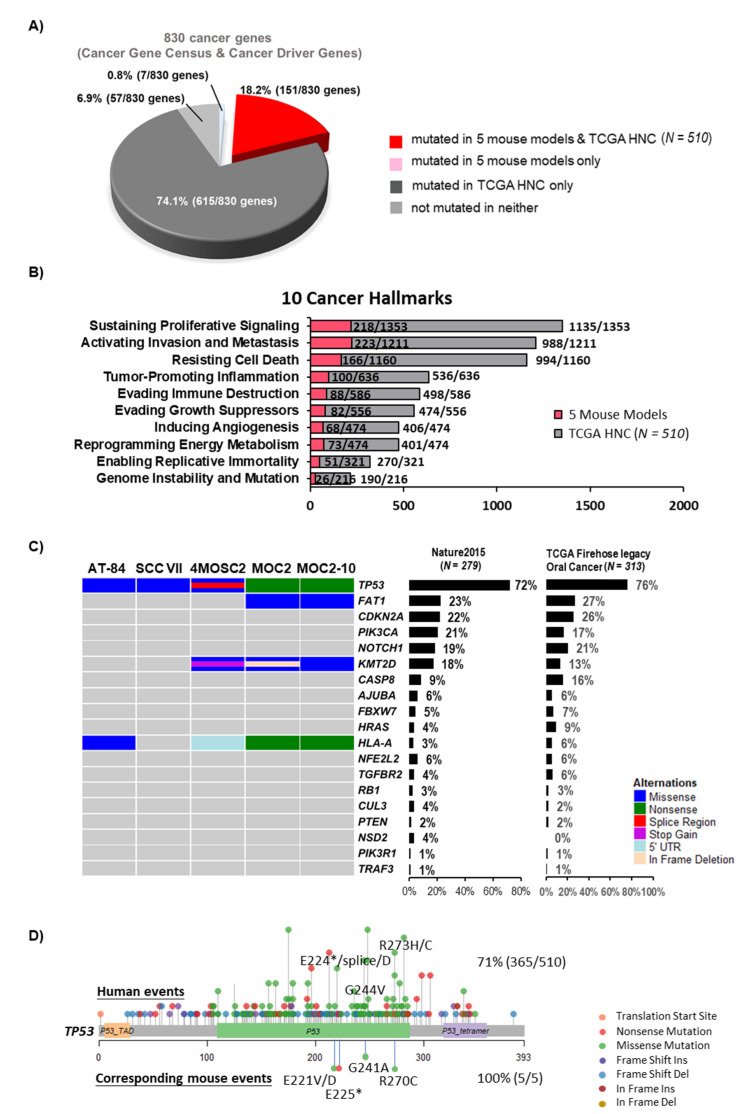
Figure 2.
Mutations in mouse models show a high resemblance to human cancer. (A) A pie chart showing the recapitulation of cancer-related somatic mutations (830 genes) in 5 mouse cell lines vs. that of The Cancer Genome Atlas (TCGA)-HNC patient tumors (N = 510). Cancer-related genes with or without alterations in 5 mouse cell lines or HNC patient tumors are indicated according to the legend at the bottom. (B) Bar graph showing the somatic mutation counts of 10 cancer hallmark gene sets harbored by 5 mouse cell lines and TCGA-HNC (N = 510). The mutation counts of HNC patients are represented by grey bars, whereas those of mouse models are represented by red bars. (C) Oncoprints for 5 mouse models showing genes with statistically significantly mutated (MutSig, Q value < 0.1), with event frequencies in TCGA-HNC, all patient tumors, as well as TCGA-HNC oral tumors indicated with percentages on the right. (D) Mapping of mutation sites of Trp53 mutations in 5 mouse models and human TP53 hotspot mutations based on whole-exome sequencing data of TCGA-HNC (N = 510). TCGA: The Cancer Genome Atlas.

