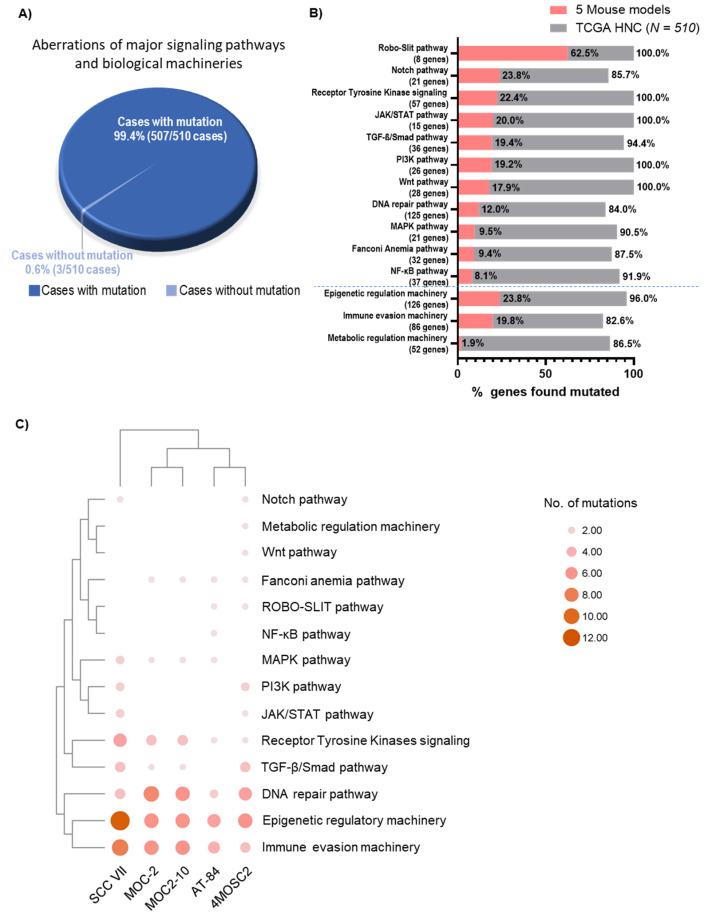
Figure 3.
Mouse models with HNC-relevant genetic aberrations of major signaling pathways and biological machineries. (A) Pie chart showing percentages of patient tumors harboring mutations of 14 pathways and machineries (Pathways: PI3K, MAPK, JAK/STAT, Notch, Wnt, NF-κB, TGF-β/Smad, ROBO–SLIT, Fanconi anemia, receptor tyrosine kinases; Machineries: DNA repair, immune evasion, metabolic regulation, epigenetic regulation) in TCGA-HNC (N = 510) with the 3D sector representing mutations of the same genes found in 5 mouse models. (B) Bar graph showing the number of pathway/machinery genes mutated in TCGA-HNC (N = 510) (grey bars) and the 5 mouse models (red bars). (C) Bubble plot showing the abundance of TCGA-HNC (N = 510) as well as 14 pathways and machineries’ mutations across 5 mouse models (AT-84, SCCVII, MOC-2, MOC2-10, and 4MOSC2).

