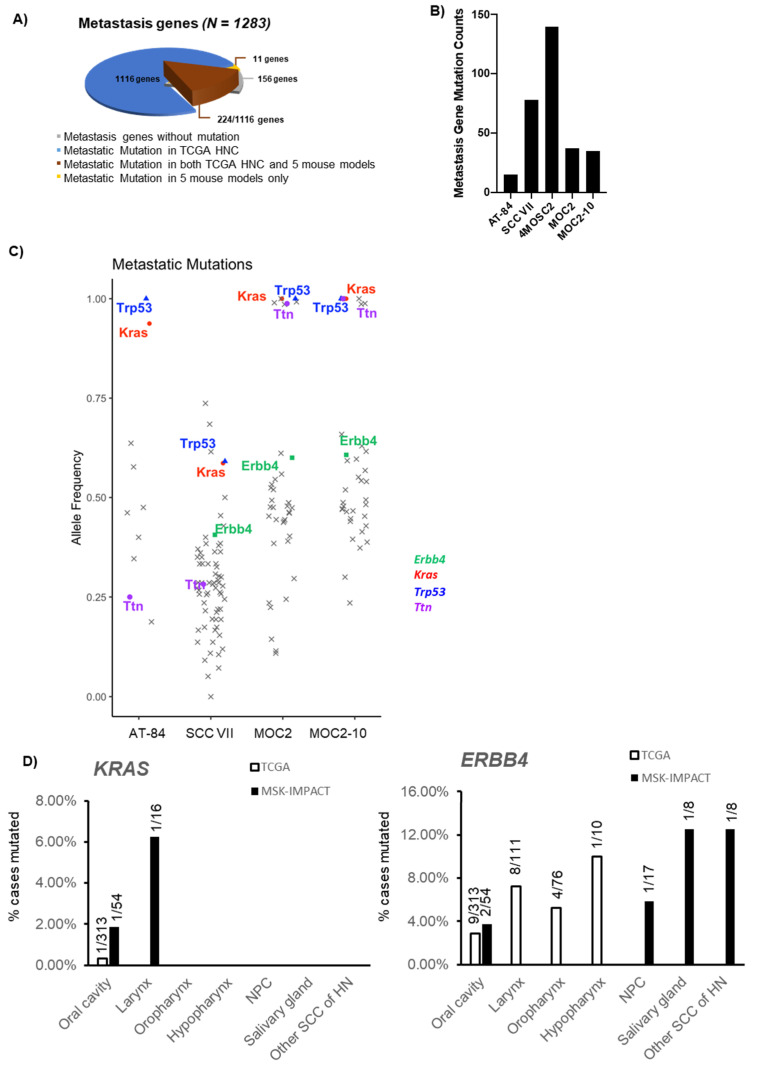
Figure 4.
Genetic analysis of 5 mouse models reveals metastasis-related alterations. (A) Pie chart showing the number of metastasis-related genes altered in 5 mouse models vs. TCGA-HNC patient tumors (N = 510). (B) Bar graph showing somatic mutation counts of metastasis-related genes in each of the five mouse models. (C) Scatter plot showing allele frequencies of metastasis-related gene mutations in each mouse model. Mutations harbored by all 5 mouse cell lines or highly related to cancer metastasis are highlighted with different marks, as displayed on the right. (D) Bar graph showing the mutation rates of KRAS and ERBB4 in HNC patient tumors from the TCGA cohort (white bars) vs. the metastatic HNC from the Memorial Sloan Kettering Cancer Center (MSK)-IMPACT cohort (black bars). Detailed subsites are shown. NPC: nasopharyngeal carcinoma; SCC: squamous cell carcinoma; HN: head and neck.

