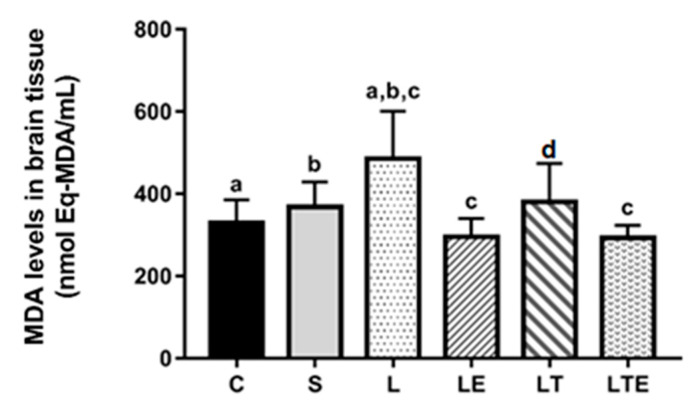
Figure 8.
Analysis of MDA levels in the brain. Brain malondialdehyde levels (nmolEq-MDA/mL) after interventions in the different groups: C, control group; S, sham group; L, injury group; LE, injury + extract group; LT, injury + training group; LTE, injury + training + extract group. Values are expressed as mean ± standard deviation (n = 10 in each group). The letters “a”, “b”, “c” and “d” when repeated indicate statistical differences between the groups as determined by one-way ANOVA with Bonferroni post-hoc correction.

